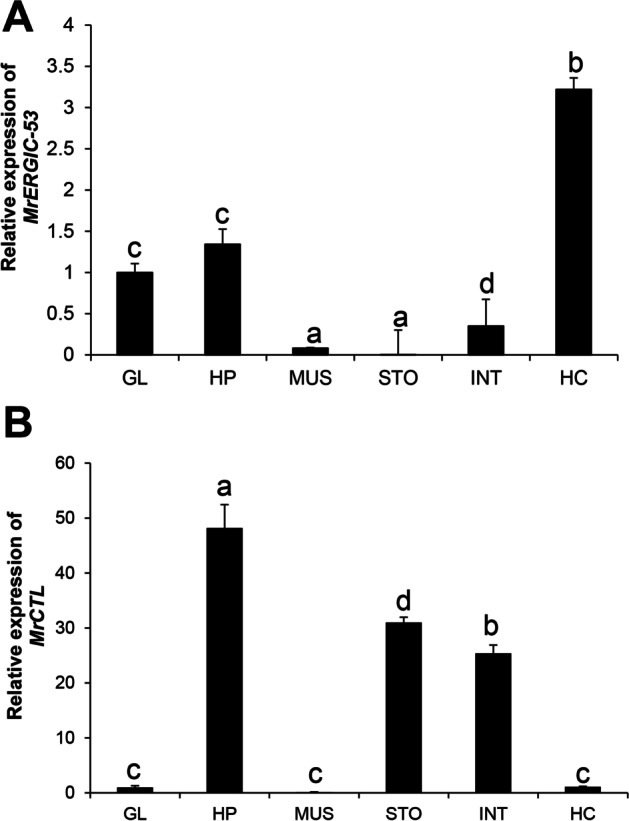
Fig. 8.

Tissue-specific expression of MrERGIC-53 and MrCTL mRNA using qPCR. (A) Relative expression of MrERGIC-53 in M. rosenbergii tissues. (B) Relative expression of MrCTL in M. rosenbergii tissues. GL gill, HP hepatopancreas, MUS muscle, STO stomach, INT intestine, HC hemocytes. β-actin (M. rosenbergii) served as the internal control to normalize RNA levels between samples. Vertical bars represent standard error (n = 3). Different letters above the bars represent significant differences between groups
