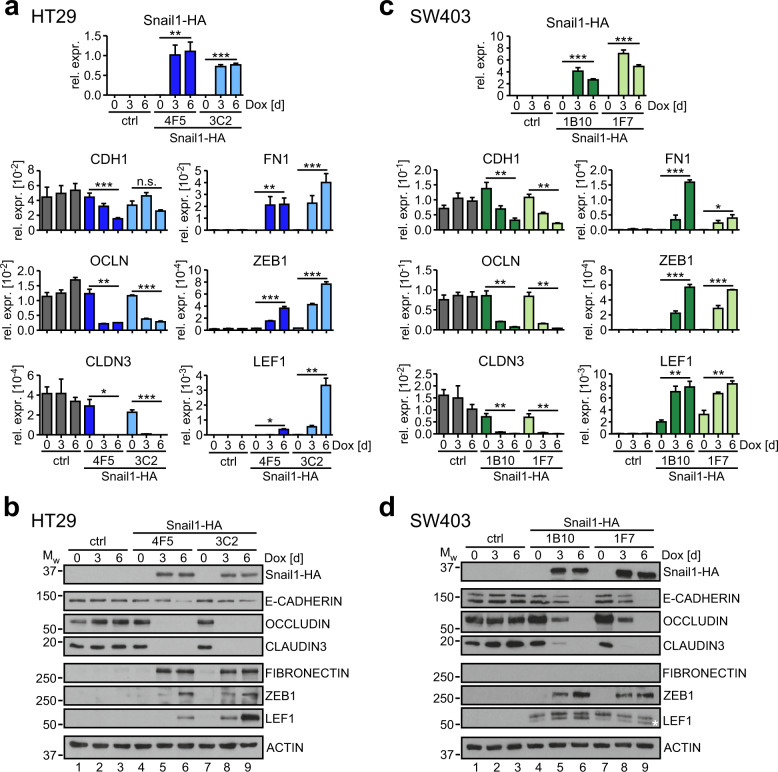
Fig. 2. The expression of EMT marker genes is changed in HT29 and SW403 CRC cells after Snail1-HA induction.
a Analyses of mRNA expression by qRT-PCR in HT29-ctrl cells and HT29-Snail1-HA clones 4F5 and 3C2 treated with Dox as indicated. Relative gene expression (rel. expr.) was calculated by normalizing to the expression of GAPDH. Plotted is the mean + SEM; n ≥ 3. Two-tailed student’s t-test; *p-value < 0.05, **p-value < 0.01, ***p-value < 0.001. b Analyses of protein expression by immunoblotting in HT29-ctrl cells and HT29-Snail1-HA clones 4F5 and 3C2 treated with Dox as indicated. Positions of molecular weight (Mw) standards in kDa are indicated on the left. One representative loading control of ACTIN is shown for reasons of simplicity. All loading controls corresponding to the depicted protein detections are given in Fig. S9a. A quantification of E-CADHERIN protein levels can be found in Fig. S5c. c Analyses of mRNA expression by qRT-PCR in SW403-ctrl cells and SW403-Snail1-HA clones 1B10 and 1F7 that were treated with Dox as indicated. Relative gene expression (rel. expr.) was calculated by normalizing to the expression of GAPDH. Plotted is the mean + SEM; n = 3. Two-tailed student’s t-test; *p-value < 0.05, **p-value < 0.01, ***p-value < 0.001. d Analyses of protein expression by immunoblotting in SW403-ctrl cells and SW403-Snail1-HA clones 1B10 and 1F7 that were treated with Dox as indicated. Positions of molecular weight (Mw) standards in kDa are indicated on the left. One representative loading control of ACTIN is shown for reasons of simplicity. All loading controls corresponding to the depicted protein detections are given in Fig. S9b. FIBRONECTIN could not be detected. Asterisk: Snail1-HA-responsive lower molecular weight LEF1 isoform. A quantification of E-CADHERIN protein levels can be found in Fig. S5c.

