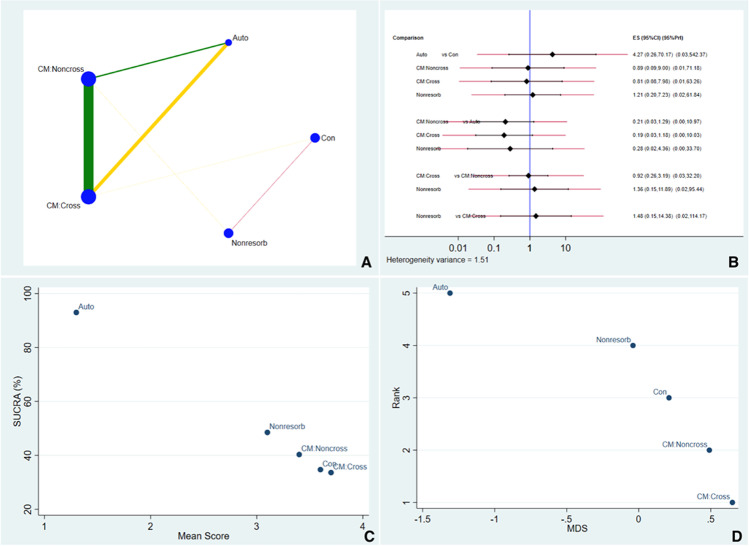
Fig. 4.
A Illustrates the network geometry plot for horizontal dimensional changes. B Predictive interval and confidence interval plot for horizontal dimensional changes. C The surface under the cumulative ranking curves (SUCRA) that expresses the percentage of effectiveness/safety each treatment has compared to an “ideal” treatment ranked always first without uncertainty. D Multidimensional scale ranking demonstrating the ranking of the sealing material in horizontal dimensional outcomes based on dissimilarity

