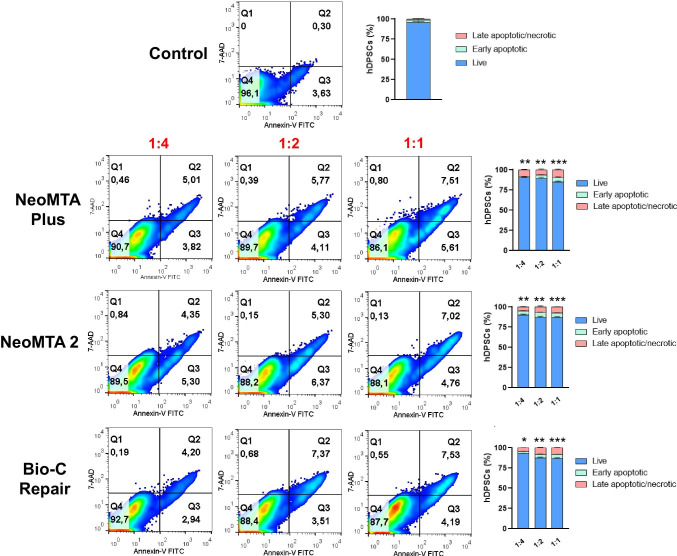
Fig. 6.
Flow cytometry analysis of cell apoptosis and necrosis induced by the different vital pulp material extracts on hDPSCs by annexin V-PE/7-AAD staining. Numbers inside representative dot plots represent percentages of live (Q4 quadrants), early apoptotic (Q3 quadrants), and late apoptotic and necrotic cells (Q1 and Q2 quadrants). Bar graphs show mean ± SD from n = 3 separate experiments. Percentages of live cells were significantly decreased compared to the control, *p < 0.05; **p < 0.01; ***p < 0.001, respectively

