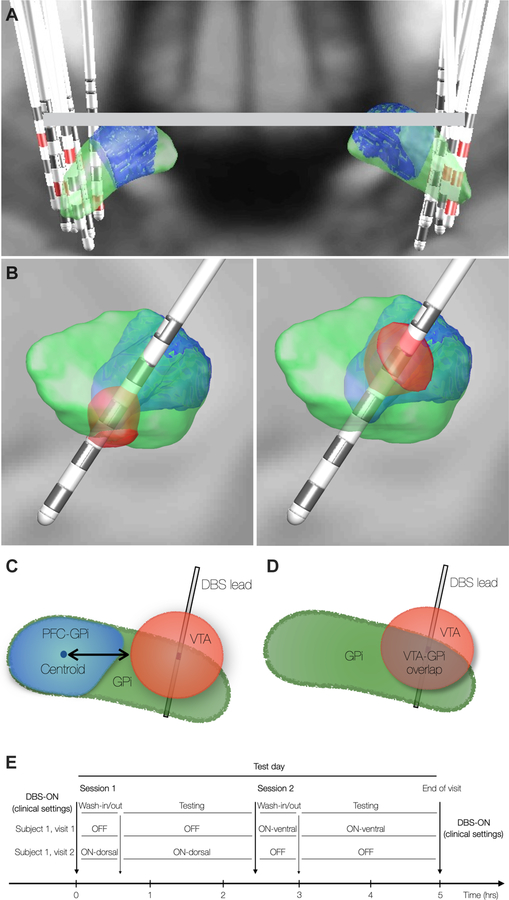
Figure 1. DBS Stimulation Parameters and Experimental Paradigm.
(A) DBS lead localization in all subjects. Green = GPi. Blue = GPi subregion with prefrontal cortex connectivity; PFC-GPi). Red = active clinical contact. (B) Simulated Volumes of Tissue Activation (VTA) in the “ventral” (left) and “dorsal” (right) conditions. Impact of stimulation measured with either distance of VTA surface to PFC-GPi centroid (C) or VTA overlap with target (D). (E) Experimental design with 3 DBS conditions: OFF, ON-dorsal, ON-ventral.

