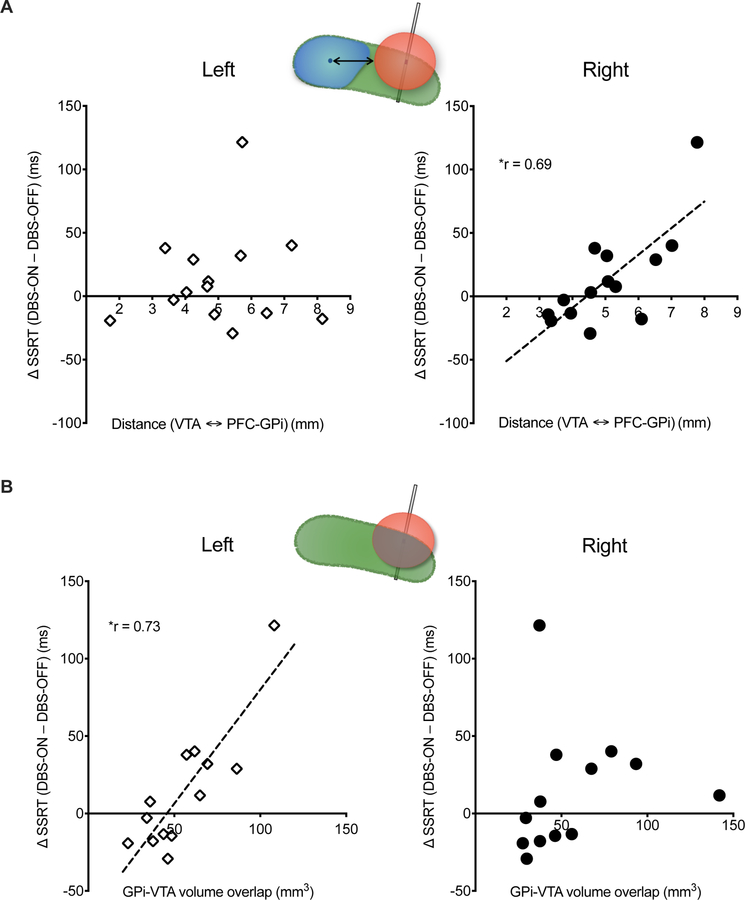
Figure 3. Stop-Signal Reaction Time and PFC-GPi Stimulation.
Correlation between SSRT and DBS volume of tissue activation (VTA). (A) Shorter distance between the right PFC-GPi centroid and VTA is correlated with lower SSRT and reduced motor impulsivity. (B) Greater volumetric overlap between VTA and left GPi correlates with longer SSRT and increased impulsivity. Cartoons in each panel illustrate the metrics used in the correlation analysis (see Figure 1 C, D for details). Left and Right indicate left vs. right hemisphere DBS. r = Spearman’s correlation coefficient. * indicates significance (p <0.05).

