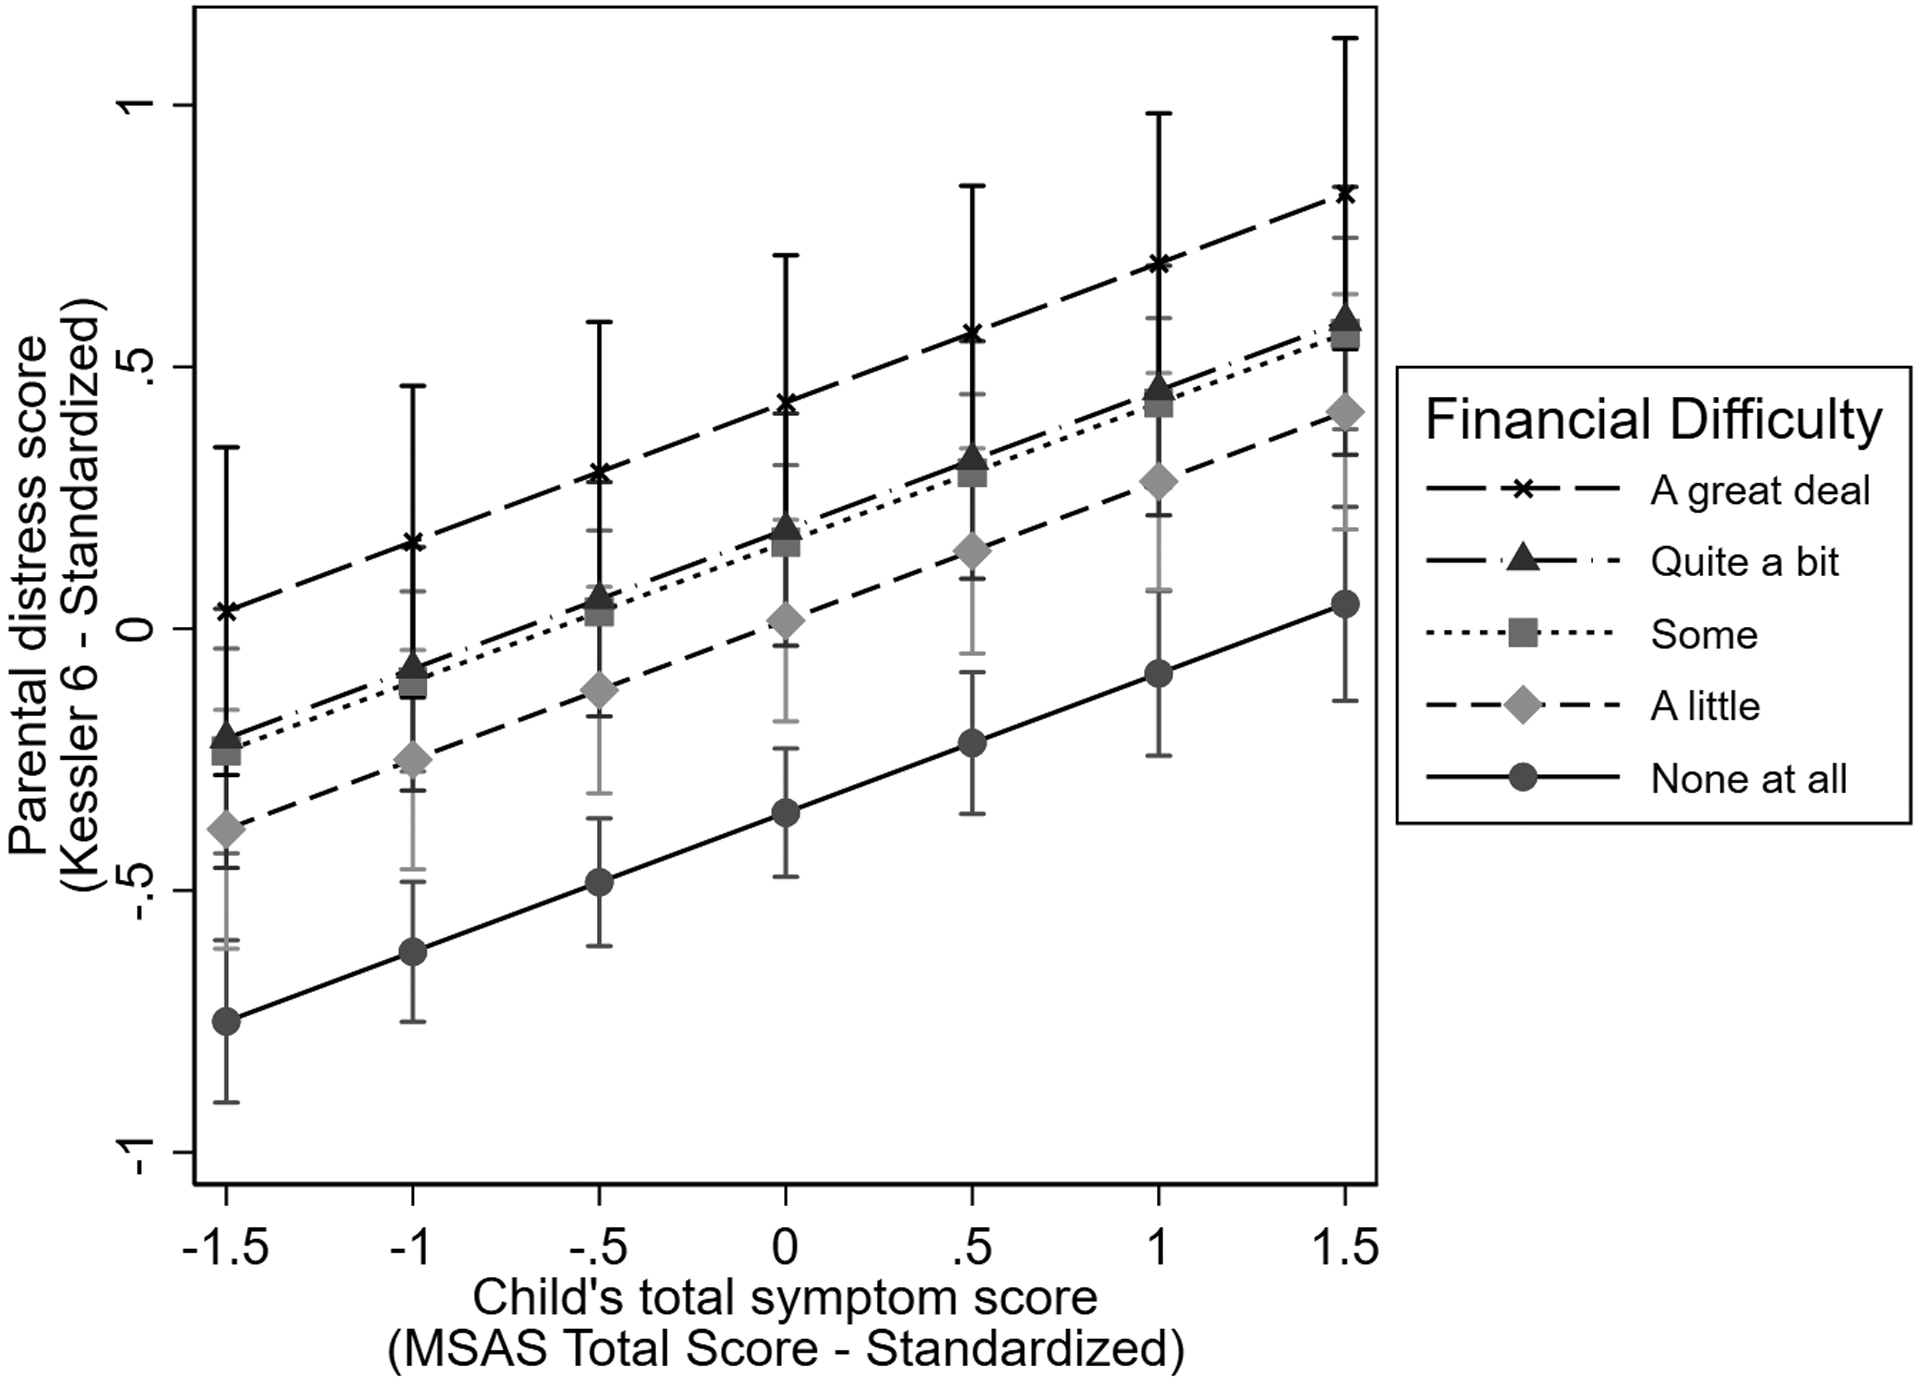
Figure 3.

Relationship between the parent’s level of distress and the child total symptom score varies by the family’s level of financial difficulty
Note: In this figure, the vertical axis plots the score on the Kessler-6, with 0 representing the mean score and +1 and −1 representing a standard deviation (SD) in the score above and below the mean; the horizontal axis plots the child’s total symptom score in a similar manner; and each of the parallel lines indicate the scores for parents experiencing different degrees of financial difficulty. The fact that these lines slope upward indicates that higher total symptom scores are associated with higher levels of parental psychological distress; and the fact that these lines are separated vertically indicates that increasing levels of financial distress are associated with increasing levels of psychological distress. Combined, the parent of a child with the lowest level of symptom score and in a family with no financial difficulty is predicted to have a level of psychological distress that is 1.6 SD less than a parent of a child with the highest level of symptom score and in a family with a great deal of financial difficulty.
