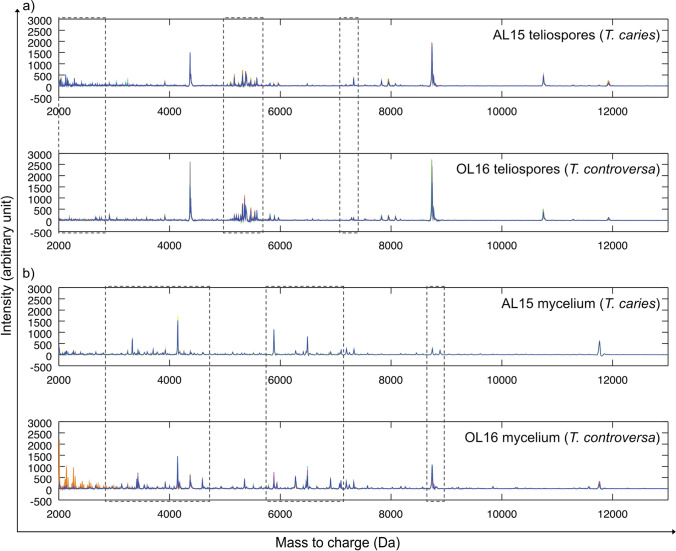
Fig. 1.
Stacked view of MALDI-TOF MS spectra visualizing the comparison of profiles of T. caries specimen AL15 and T. controversa specimen OL16 obtained by MALDI-TOF mass spectrometry using a teliospores as the starting material, b mycelium as the starting material. Overlapping peaks that were identical in location and intensity in all nine single spectra of a stack are shown in blue color, whereas peaks that occurred only in individual spectra or had divergent intensities are visualized in other colors. The parts of the mass spectra that were different between the two specimens are highlighted with boxes

