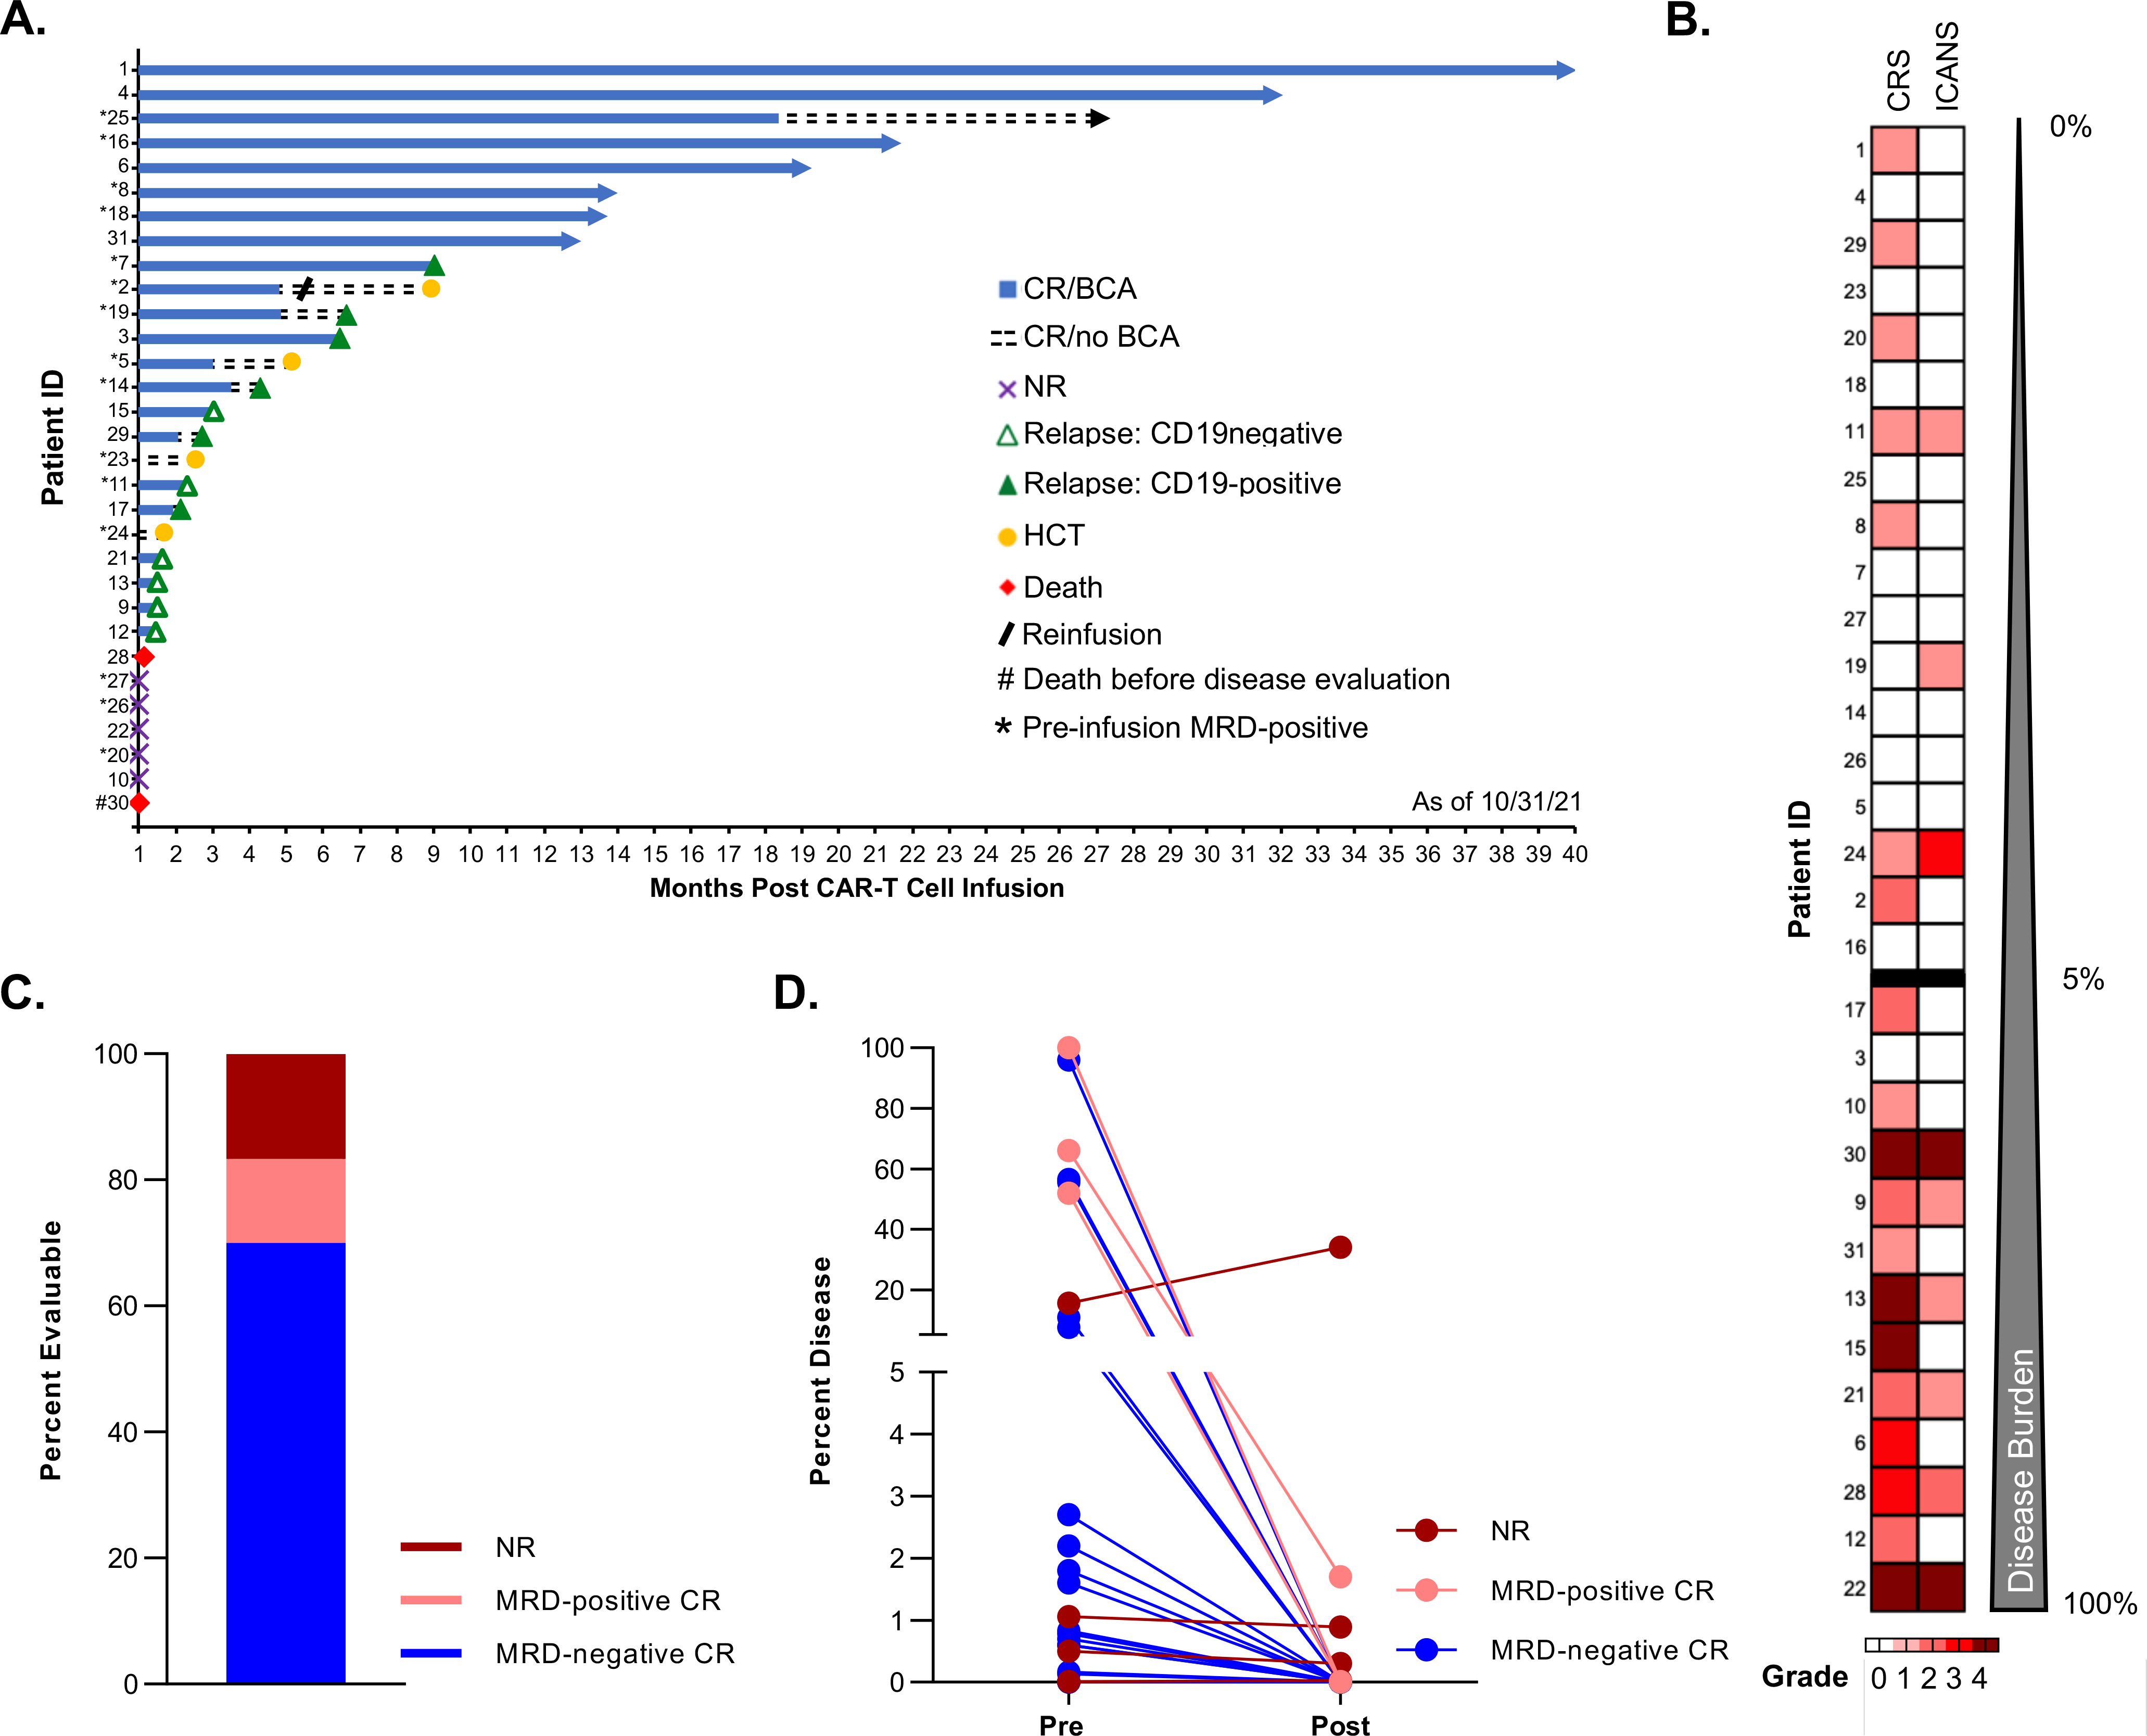
Figure 1. Disease response and toxicities of pediatric and AYA patients treated with lymphodepletion and tisagenlecleucel.

A. Swimmer plot depicting the longitudinal outcomes of the entire patient cohort (n=31, each lane represents a single patient), including the initial response at 4 weeks post CAR T-cell infusion (CR: complete response; NR: no response), the duration of B-cell aplasia (BCA) and subsequent events (relapse [CD19-positive or CD19-negative]), the time of planned consolidative allogeneic hematopoietic cell transplantation (HCT), and death. For each patient, the data end at the time of the first event (NR, relapse, HCT, or death). Ongoing remission without any event is indicated by an arrow. B. Heatmap depicting the maximum grade of cytokine release syndrome (CRS) and immune effector cell–associated neurotoxicity syndrome (ICANS) for each treated patient. Patients are ordered by increasing burden of leukemia (%) as measured by flow cytometry in the bone marrow before tisagenlecleucel therapy. C. Treatment response at approximately 4 weeks post infusion among the 30 evaluable patients. D. Change in bone marrow disease burden (%) measured using pretreatment and post tisagenlecleucel therapy evaluations. Each line represents a single patient and is color coded to indicate the response.
