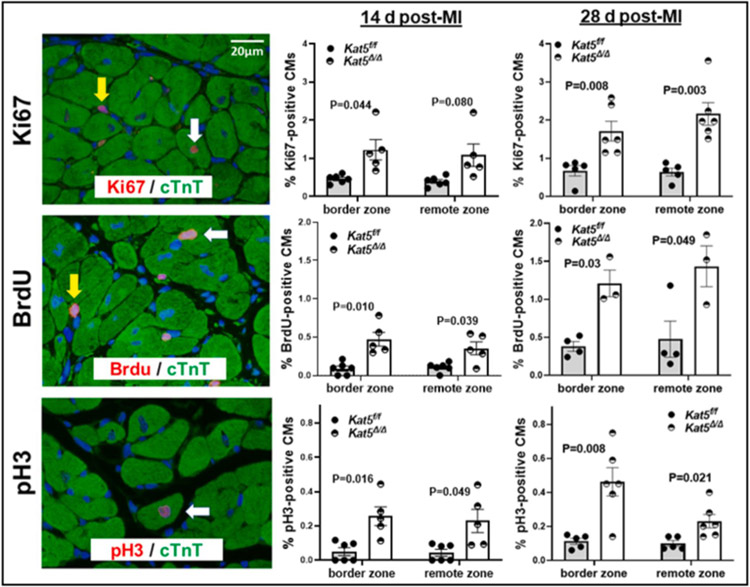
Figure 4. Increased CM cell-cycle activation in the border and remote zones of infarcted Tip60-depleted hearts at 14 and 28 days post-MI.
Left column, representative images photographed at 600x showing immunostaining of Ki67-, BrdU-, and pH3-positive nuclei, and co-staining with cTnT to assess CM identity. White/yellow arrows respectively denote positive CMs/non-CMs. Middle column, results of cell counting showing significantly increased percentages of Ki67-, BrdU-, and pH3-positive CMs on day 14 post-MI. The right column shows that each cell-cycle activation marker was further increased on day 28 post-MI. All counting was conducted in blind. At least 1,000 CMs were evaluated in each biological replicate (14 d post-MI: n=6 mice for Kat5f/f and n=5 mice for Kat5Δ/Δ; 28d post-MI: n=5 mice for Kat5f/f and n=6 mice for Kat5Δ/Δ). Data were reported as Mean ± SEM and compared by unpaired, two-tailed Student’s t tests with Welch’s correction.

