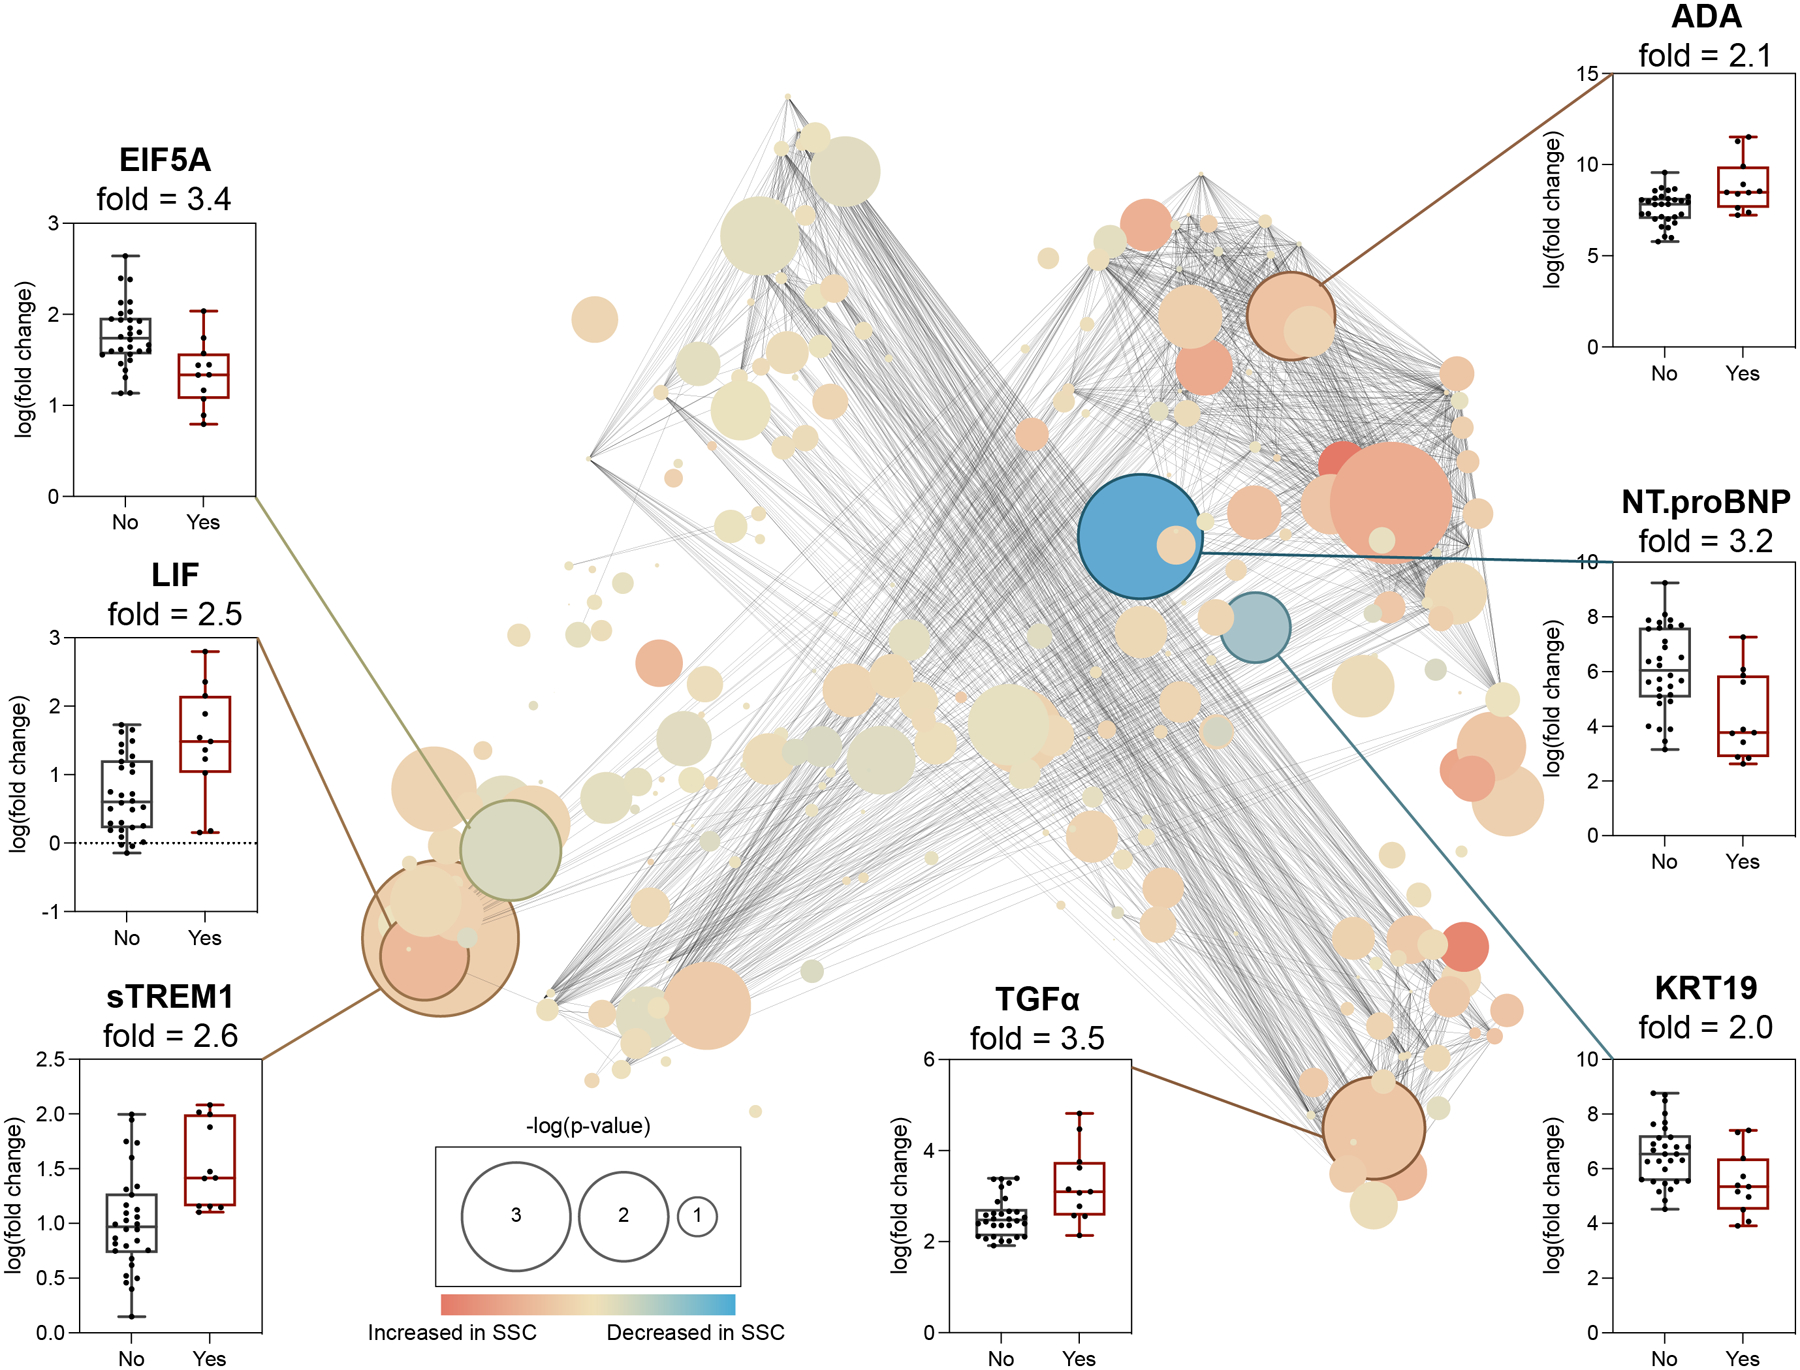
Figure 2. POD1 plasma proteomic features differentiating patients with and without SSC.

Center: Correlation network depicting plasma proteomic features of the SG model differentiating patients with and without SSC. Edges represent the correlation between features (Spearman coefficient > 0.9). Blue/orange nodes highlight positive/negative correlation with SSC. Node size reflects -log10 of p-value (Spearman). Periphery: Proteomic features with fold > 2.0 (bootstrap analysis, Supp. Fig. 3) are shown as box plots. Four features, ADA, TGFα, sTREM1, and LIF, were elevated while three features, KRT19, NT.proBNP, EIF5A, were decreased in patients with (red) compared to without (black) an SSC.
