
Figure 3. Lesion-symptom maps.
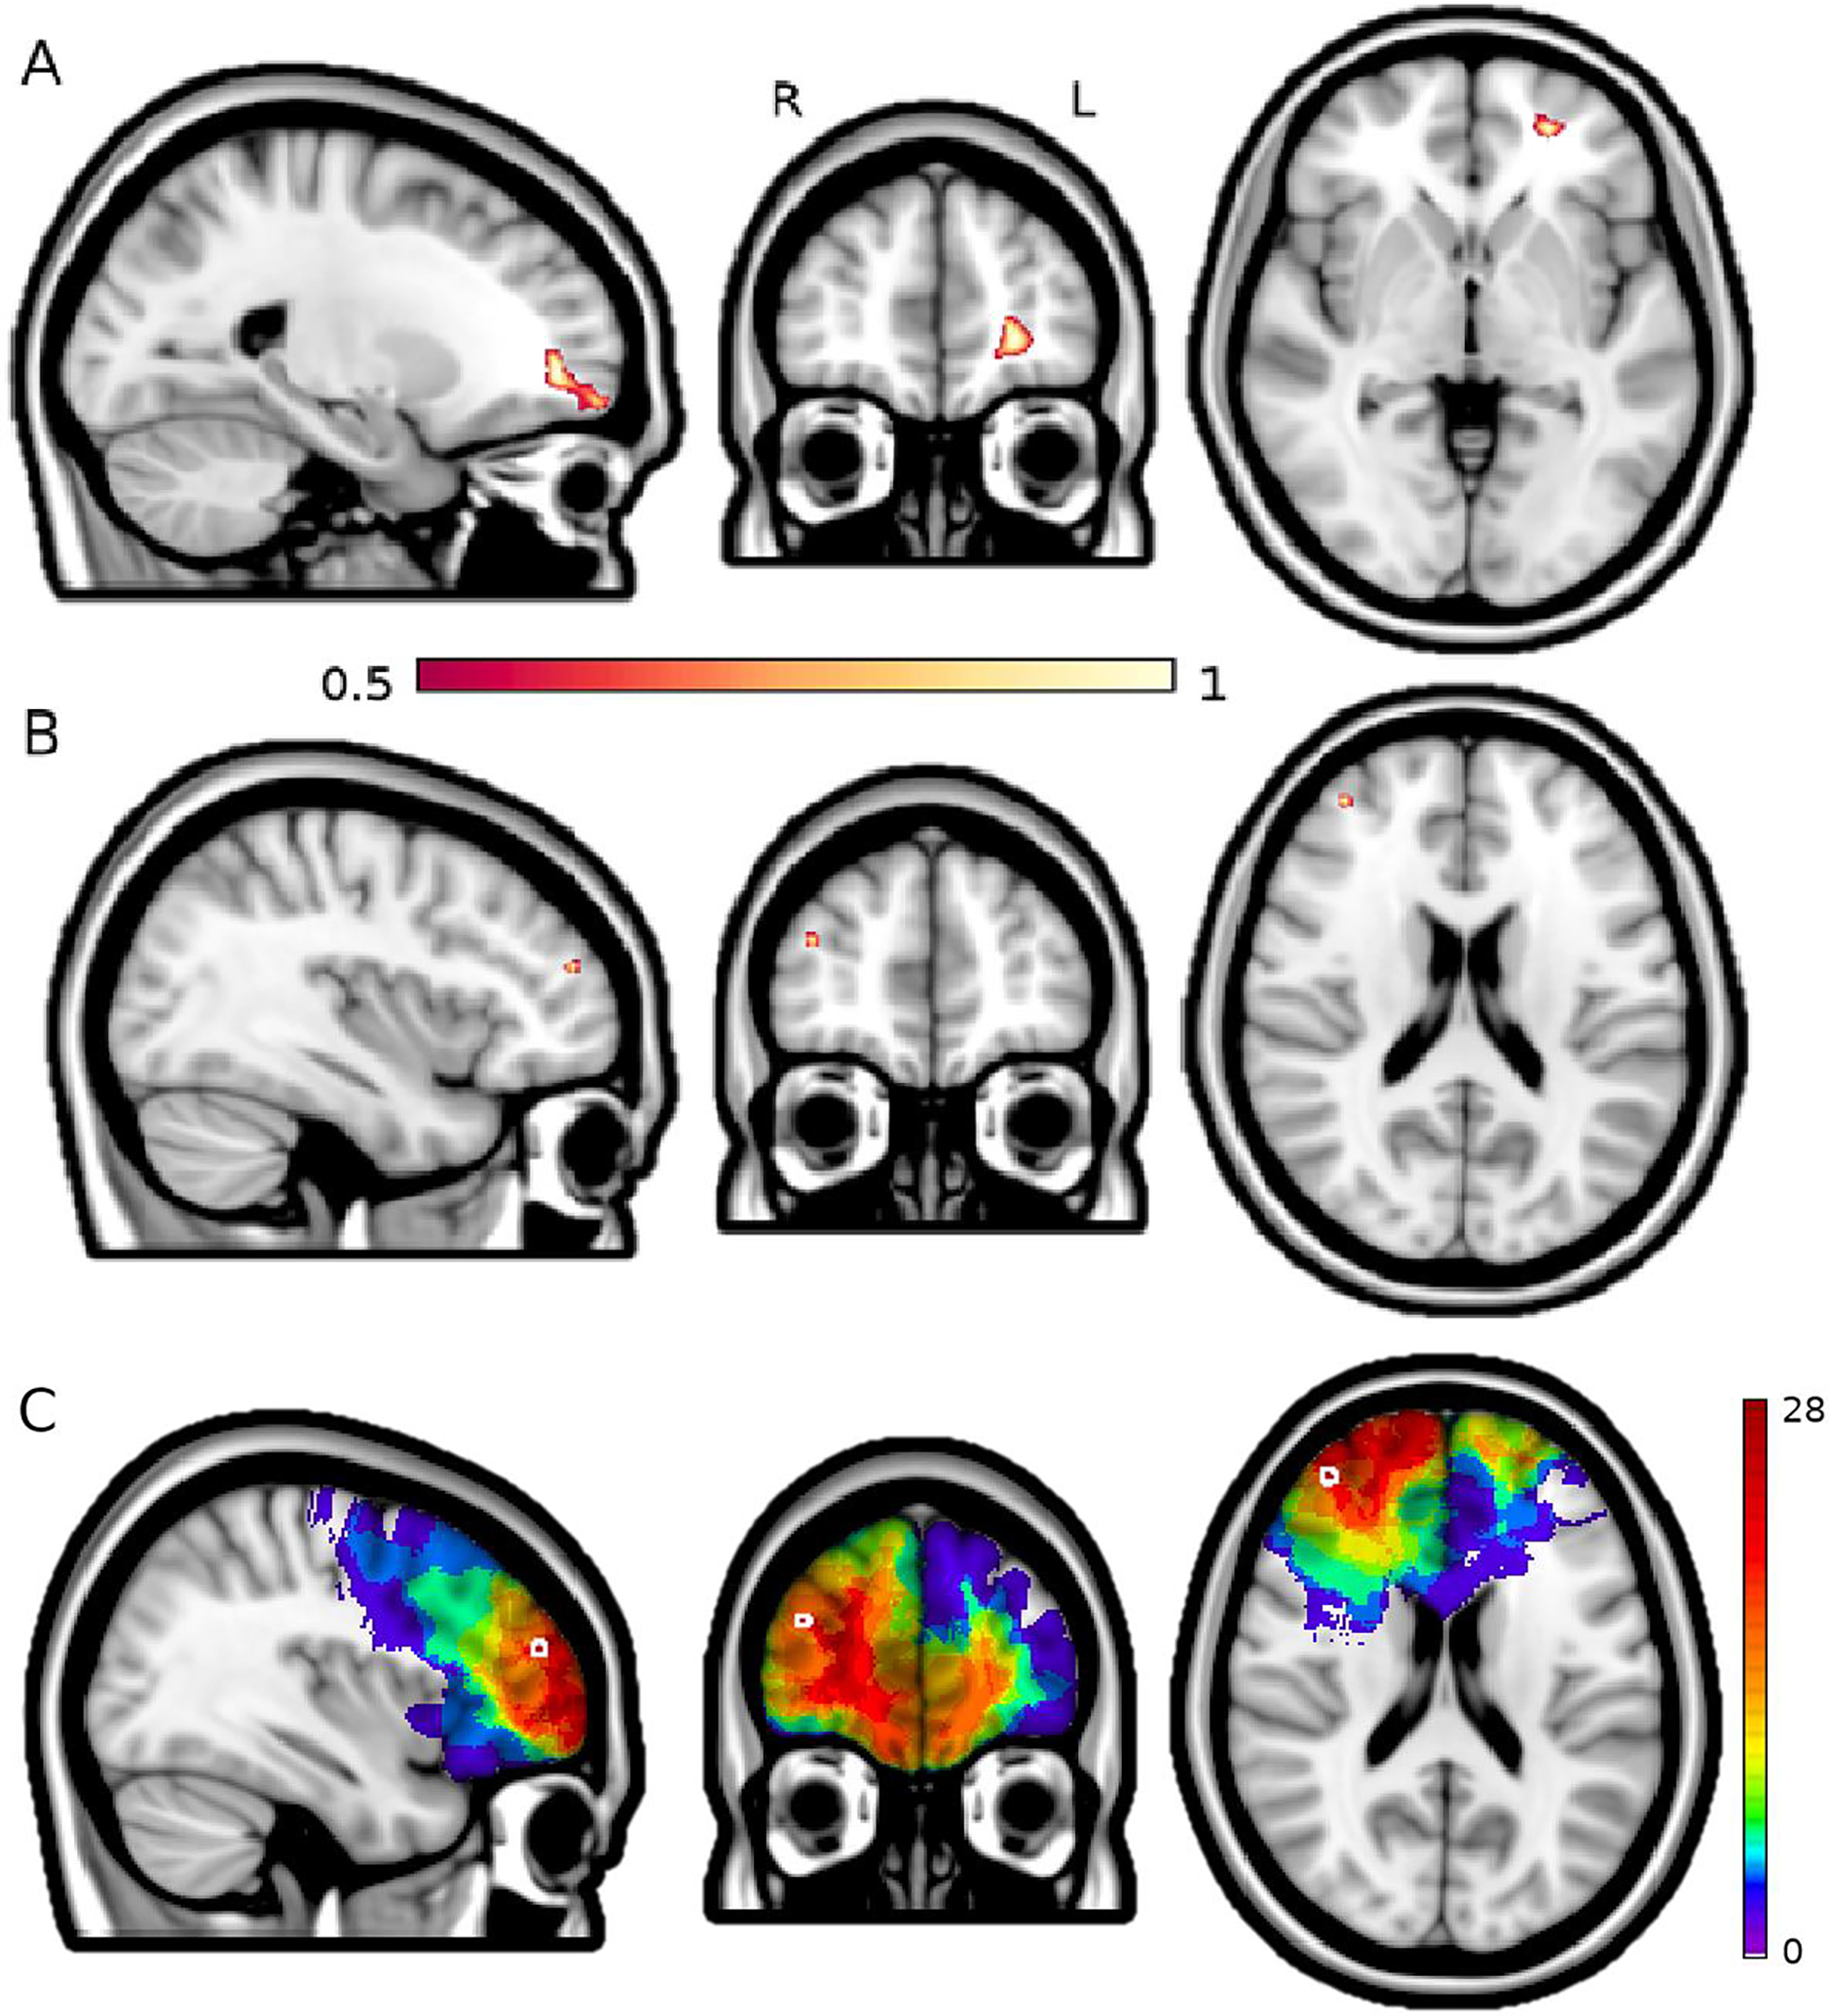
Panel A shows a region of the white matter deep to the left ventromedial PFC with the strongest association to emotional/social personality disturbance (p = 2.28 ×10⁻⁵, peak MNI coordinate −23, 49, −2). B shows a region in the right middle frontal gyrus of the dorsolateral prefrontal cortex that, when lesioned, is significantly associated with dysexecutive personality disturbance (p = 0.03, peak voxel 38, 49, 19). The color scale reflects the strength of association of anatomical regions with the respective personality disturbance score, with voxel weights distributed on a unit-less scale of 0–1 generated by the LESYMAP program to display the strength of regional associations within significant maps, which we thresholded at 0.5 to display the strongest findings within those maps. Panel C shows the distribution of lesions that intersect with the statistically significant region for dysexecutive personality disturbance (Panel B), thus contributing to that association.