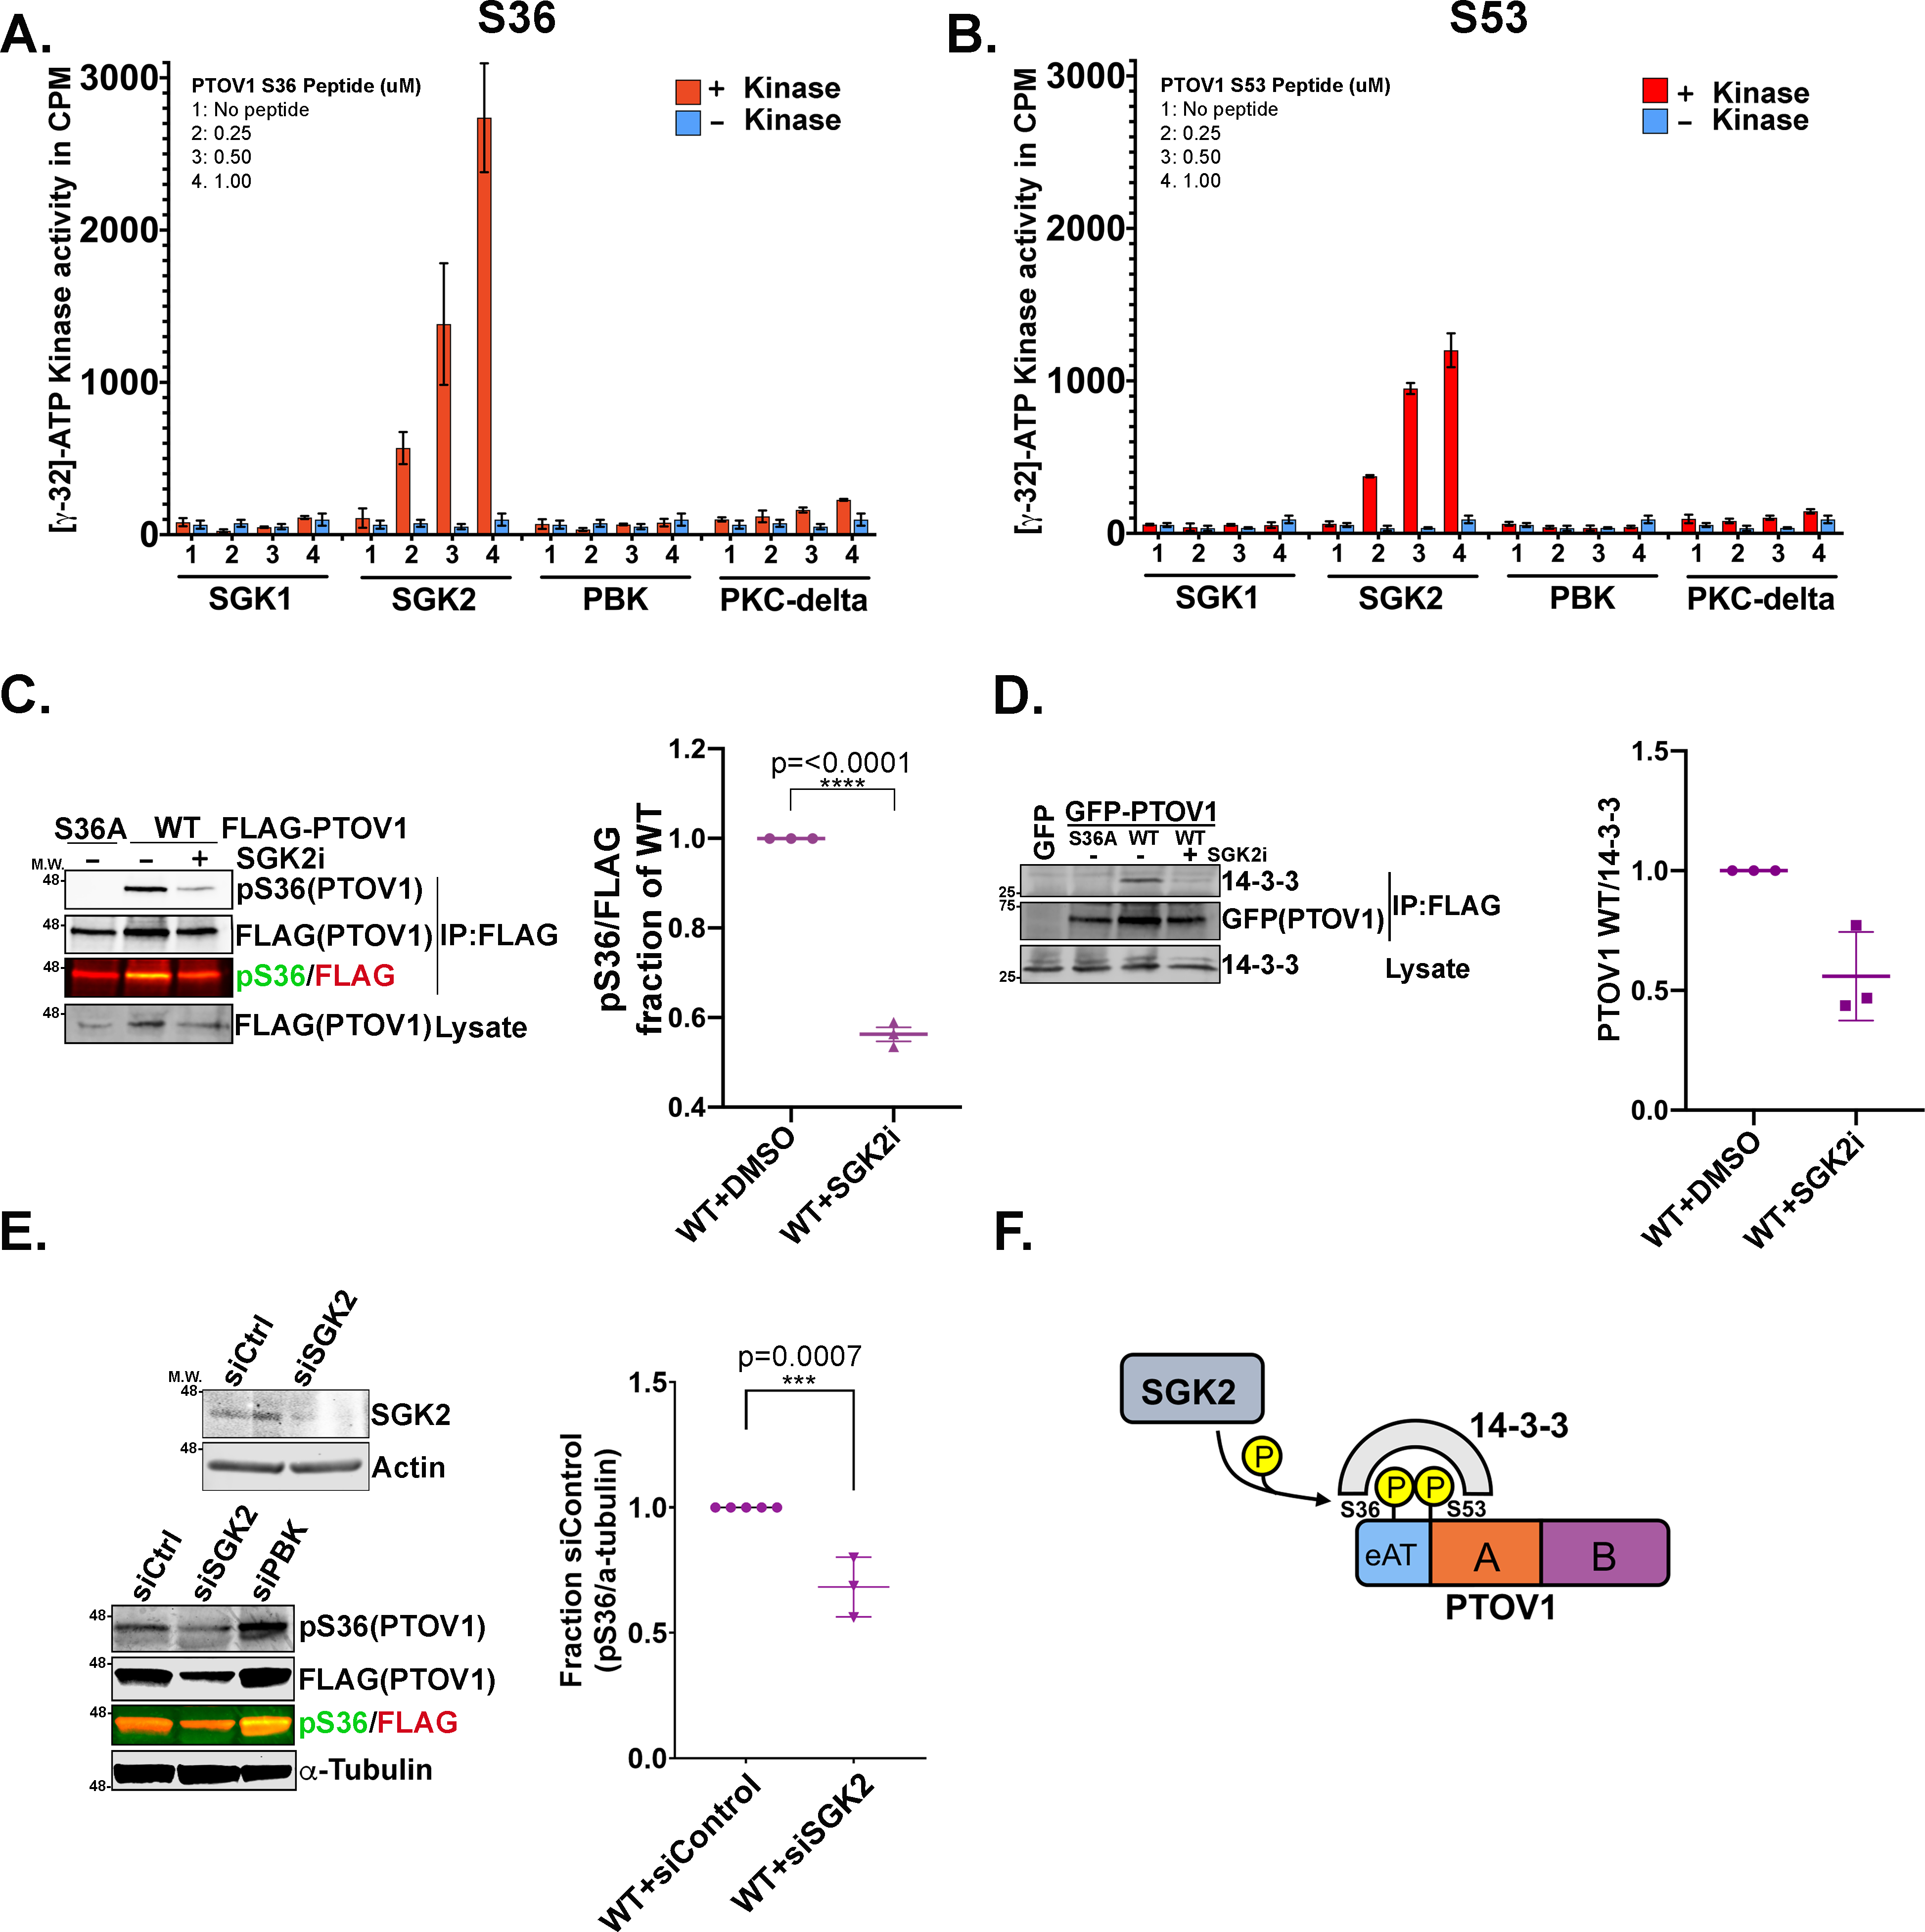
Figure 2. SGK2 phosphorylates PTOV1 to promote 14-3-3 binding.

A) Radiometric assays were performed with the indicated kinases incubated with a biotin-tagged PTOV1 peptide encompassing S36. Corrected kinase activity (raw value minus sample peptide background) was measured in biological triplicate. Graph shows mean kinase activity in counts per minute (cpm) with error bars indicating standard deviations (SD). B) Radiometric kinase assays were performed as in panel A but against a peptide encompassing S53. C) PC3 cells stably expressing FLAG-PTOV1 WT or S36A were treated with 10 μM of the SGK2 inhibitor (SGK2i) GSK 650394 for 48 hours, followed by IP on FLAG resin and immunoblotting for pS36 PTOV1 and FLAG. Right panel shows quantification (LI-COR infrared imaging) of pS36 signal normalized to FLAG (coIP) and expressed as a fraction of normalized WT from three biological replicates. Error bars represent SEM; p-values were calculated using a two-tailed Student’s t-test. D) PC3 cells stably expressing GFP-PTOV1 (WT or S36A) were treated with SGK2i as in panel C, followed by immunoprecipitation of GFP-PTOV1 on GFP-trap resin and immunoblotting for 14-3-3. E) Upper panel shows an immunoblot validation of SGK2 siRNA (signal shown is endogenous SGK2) in PC3 cells. Lower panel shows pS36 PTOV1 immunoblot signal from PC3 cells stably expressing FLAG-PTOV1 and transfected with the indicated siRNAs for 48 hours. Right graph shows quantitation of pS36 signal normalized to loading control from 3 biological replicates. Error bars represent SEM; p-values were calculated using a two-tailed Student’s t-test. F) A model describing the relationship between SGK2, PTOV1 and 14-3-3.
