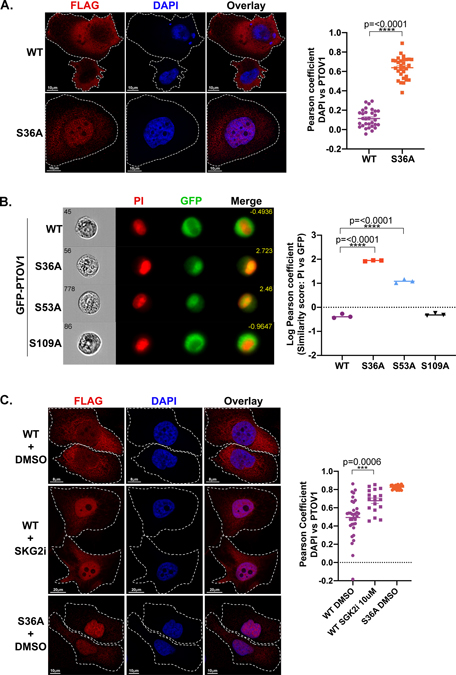
Figure 3. Loss of 14-3-3 binding leads to an accumulation of PTOV1 in the nucleus.
A) PC3 cells stably expressing FLAG-PTOV1 WT or S36A were analyzed by confocal imaging, deconvolved by Hyugens software and assessed for cytosolic and nuclear localization of PTOV1. Right panel shows Pearson coefficient (Hyugens colocalization software) of PTOV1 colocalization with DAPI. B) PC3 cells stably expressing GFP-PTOV1 (WT or indicated mutants) were analyzed by imaging flow cytometry for nuclear localization of PTOV1 as a function of overlap with propidium iodide (PI) nuclear stain. Right panel shows quantification of PTOV1/PI colocalization expressed as a log transformed Pearson coefficient. Each point represents the median similarity score from a separate population of cells. C) PC3 cells from panel A were treated with 10 μM SGK2 inhibitor (GSK 650393) as in Figure 2B. Right panel shows quantification as in panel A.

