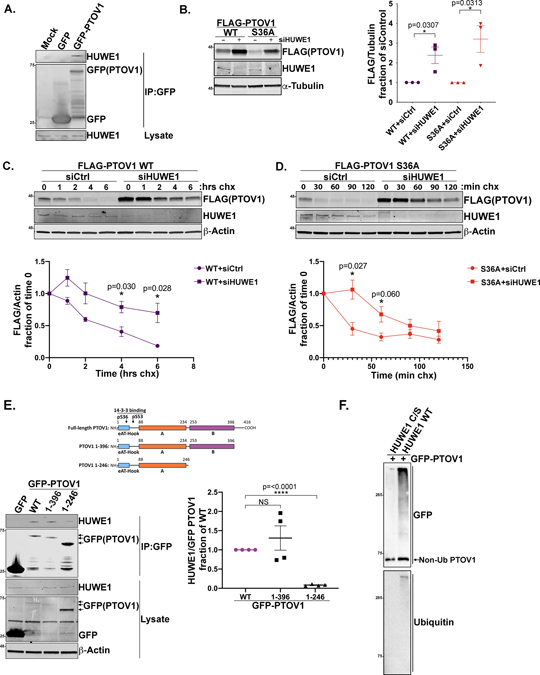
Figure 5. HUWE1 interacts with PTOV1 and controls PTOV1 stability.
A) HEK-293T cells overexpressing GFP or GFP-PTOV1 (or mock transfected) were subject to IP on GFP-Trap resin, followed by immunoblotting for HUWE1 and GFP. B) PC3 cells stably expressing FLAG-PTOV1 WT or S36A were transfected with siRNA against HUWE1 or a control sequence (non-specific), followed by immunoblotting for FLAG (PTOV1) and indicated proteins. Right panel shows quantification of FLAG (PTOV1) signal normalized to α-Tubulin and expressed as a fraction of control siRNA treatment. Error bars represent SD and p-values were calculated using a two-tailed Student’s t-test from 3 biological replicates. C) PC3 cells stably expressing FLAG-PTOV1 WT were transfected with siRNA against HUWE1 or control siRNA for 48 hours, then treated with CHX as in Figure 4A. Cells were harvested at timepoints that were determined empirically to visualize PTOV1 WT degradation. Lower panel shows quantification of signal from three biological replicates analyzed as in Figure 4A. Error bars represent SD. D) PC3 cells stably expressing FLAG-PTOV1 S36A were treated and analyzed as in panel C. Quantification represents three biological replicates and error bars represent SD. E) HEK-293T cells were transfected with GFP, GFP-PTOV1 WT or indicated GFP-tagged PTOV1 truncation mutants, followed by IP on GFP-Trap resin and immunoblotting for HUWE1 and indicated proteins. Right panel shows quantification of HUWE1 coIP signal normalized to the GFP(PTOV1) coIP signal for each mutant and expressed as a fraction of normalized HUWE1 coIP signal for GFP-PTOV1 WT. Error bars represent SEM and p-values were calculated using a two-tailed Student’s t-test from four biological replicates. F) GFP-PTOV1 was immunopurified from HEK-293T cells and incubated with ubiquitin and recombinant human HUWE1 HECT domain or a catalytically inactive version of the HECT domain (C/S), followed by immunoblotting for GFP and ubiquitin.

