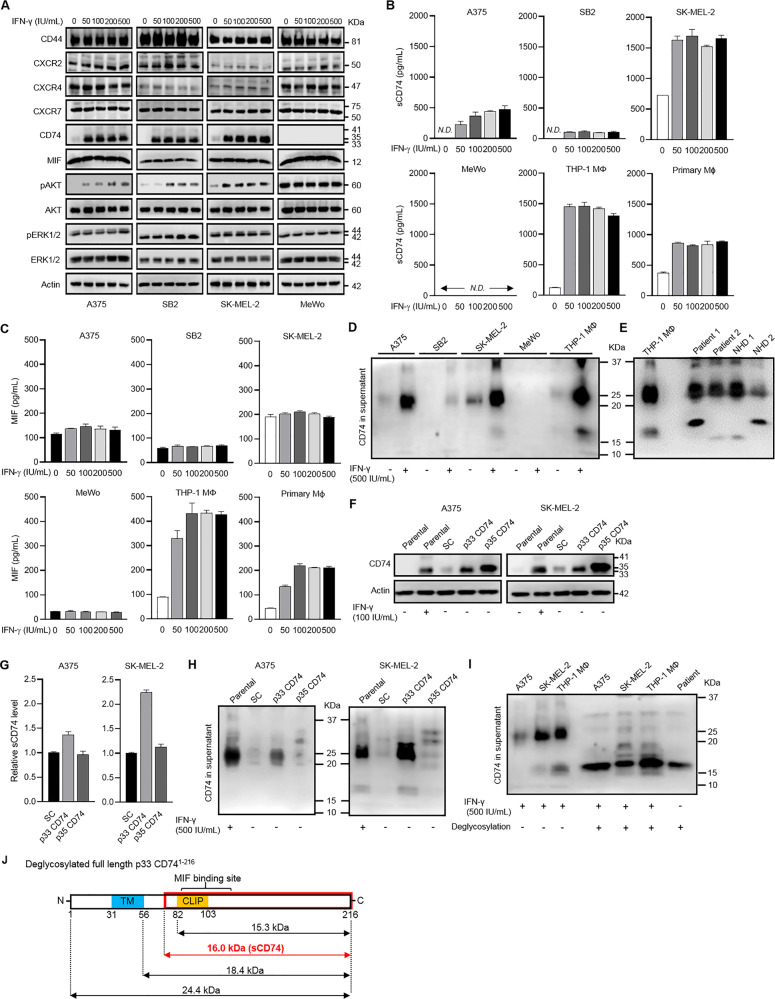
Fig. 2. CD74 expression and release of sCD74 from melanoma cell lines and immune cells.
A WB analysis of changes in CD44, CXCR2, CXCR4, CXCR7, CD74, MIF, pAKT, AKT, pERK1/2, and ERK1/2 expressions in response to IFN-γ (0–500 IU/mL) in A375, SB2, SK-MEL-2, and MeWo. Actin, AKT, and ERK1/2 were used as loading controls. B Release of sCD74 in supernatants 24 h after IFN-γ stimulation (0–500 IU/mL) in A375, SB2, SK-MEL-2, MeWo, THP-1 MΦ, and primary MΦ measured by ELISA (n = 3). C Release of MIF in supernatants 24 h after IFN-γ stimulation (0–500 IU/mL) in A375, SB2, SK-MEL-2, MeWo, THP-1 MΦ, and primary MΦ measured by ELISA (n = 4). D WB analysis of sCD74 in supernatants of A375, SB2, SK-MEL-2, MeWo, and THP-1 MΦ with or without 500 IU/mL IFN-γ stimulation. E WB analysis of sCD74 in the sera of 2 melanoma patients and 2 NHDs. Supernatant of THP-1 MΦ after 500 IU/mL IFN-γ stimulation was used as a reference control. F WB analysis of CD74 in A375 and SK-MEL-2 infected with lentivirus-expressing SC, p33 CD74, and p35 CD74. Parental cells with or without 100 IU/mL IFN-γ stimulation were used as controls. G Release of sCD74 in supernatants under basal conditions in A375 and SK-MEL-2 infected with lentivirus-expressing SC, p33 CD74, and p35 CD74 measured by ELISA (n = 3), and the fold-change relative to sCD74 levels in supernatants of SC cells is shown as bar graphs. H WB analysis of sCD74 in supernatants of A375 and SK-MEL-2 infected with lentivirus-expressing SC, p33, and p35 CD74. Parental cells under 500 IU/mL IFN-γ stimulation were used as a control. I WB analysis of sCD74 in supernatants of A375, SK-MEL-2, and THP-1 MΦ with or without deglycosylation treatment under 500 IU/mL IFN-γ stimulatory conditions. Serum of a melanoma patient was also deglycosylated. J Schematic illustration of deglycosylated full-length p33 CD741-216. Considering that MW of deglycosylated sCD74 was approximately 16 KDa, sCD74 was equivalent to a part of full-length CD74 (red box). Graph values represent mean ± SD. CLIP class-II-associated invariant chain peptide, ELISA enzyme-linked immunosorbent assay, IFN-γ interferon-γ, MW molecular weight, MΦ macrophage, NHD normal healthy donor, N.D. not detectable, SC scramble, SD standard deviation, TM transmembrane, WB Western blot.

