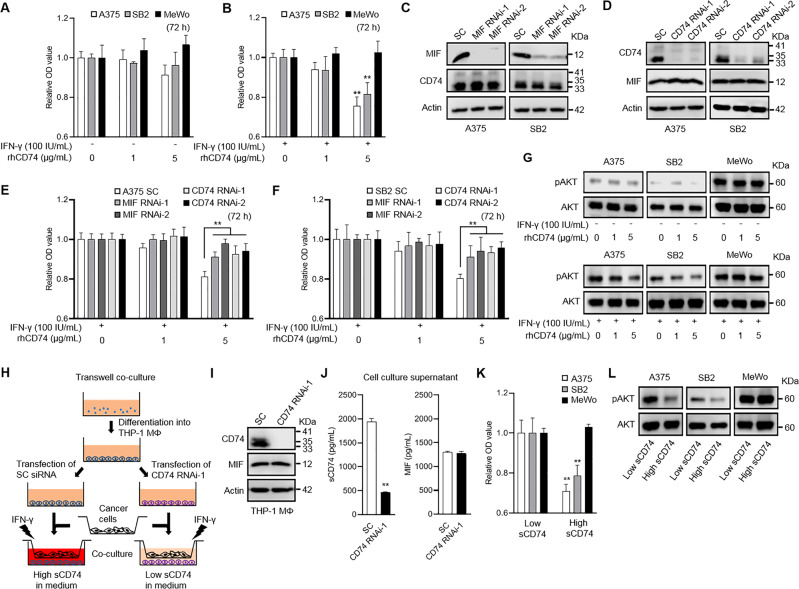
Fig. 4. Impact of sCD74 on melanoma cell growth.
A, B Cell-proliferation assay in A375, SB2, and MeWo. Cells were treated with different concentrations of rhCD74 (0, 1, and 5 µg/mL) for 72 h under basal conditions (A) or under 100 IU/mL IFN-γ stimulatory conditions (B). Results represent the fold change relative to the O.D. value of each cell line treated with 0 µg/mL rhCD74 (n = 6). C Efficacies of two individual siRNAs in knocking down MIF were analyzed by WB in A375 and SB2. MIF siRNAs did not change CD74 expression. SC siRNA was used as a reference control. D Efficacies of two individual siRNAs in knocking down CD74 were analyzed by WB in A375 and SB2. CD74 siRNAs did not change MIF expression. SC siRNA was used as a reference control. E, F Cell-proliferation assay in A375 (E) and SB2 (F) transfected with SC siRNA, MIF RNAi-1 and -2, and CD74 RNAi-1 and -2. Cells were treated with different concentrations of rhCD74 (0, 1, and 5 µg/mL) for 72 h under 100 IU/mL IFN-γ stimulatory conditions. Results represent the fold change relative to the O.D. value of each transfected cell treated with 0 µg/mL rhCD74 (n = 6). Cell-growth inhibitory effect of 5 µg/mL rhCD74 was significantly diminished in A375 and SB2 transfected with MIF RNAi-1 and -2, and CD74 RNAi-1 and -2, compared with those transfected with SC siRNA. G WB analysis of pAKT in A375, SB2, and MeWo treated with different concentrations of rhCD74 (0, 1, and 5 µg/mL) without IFN-γ stimulation (upper) or with 100 IU/mL IFN-γ stimulation (lower). AKT was used as a loading control. H Schematic illustration of transwell coculture system. I WB analysis of CD74 and MIF in cell lysate of THP-1 MΦ transfected with SC siRNA or CD74 RNAi-1. J sCD74 and MIF levels in supernatants of THP-1 MΦ transfected with SC siRNA or CD74 RNAi-1. K Cell-proliferation assay in A375, SB2, and MeWo 48 h after coculture with THP-1 MΦ. High and low concentrations of sCD74 in medium were obtained by transfecting SC siRNA or CD74 RNAi-1 to THP-1 MΦ, respectively, in the presence of 100 IU/mL IFN-γ. Results represent the fold change relative to the O.D. value of each cell line cultured in low sCD74-containing medium (n = 4). L WB analysis of pAKT in A375, SB2, and MeWo in low and high sCD74-containing medium. AKT was used as a loading control. Graph values represent mean ± SD. Significance in difference between two groups was tested by Student t-test. **p < 0.01. IFN-γ interferon-γ, MIF macrophage-migration inhibitory factor, MΦ macrophage, rh recombinant human, SC scramble, SD standard deviation, siRNA short-interference RNA, WB Western blot.

