Figure 6.
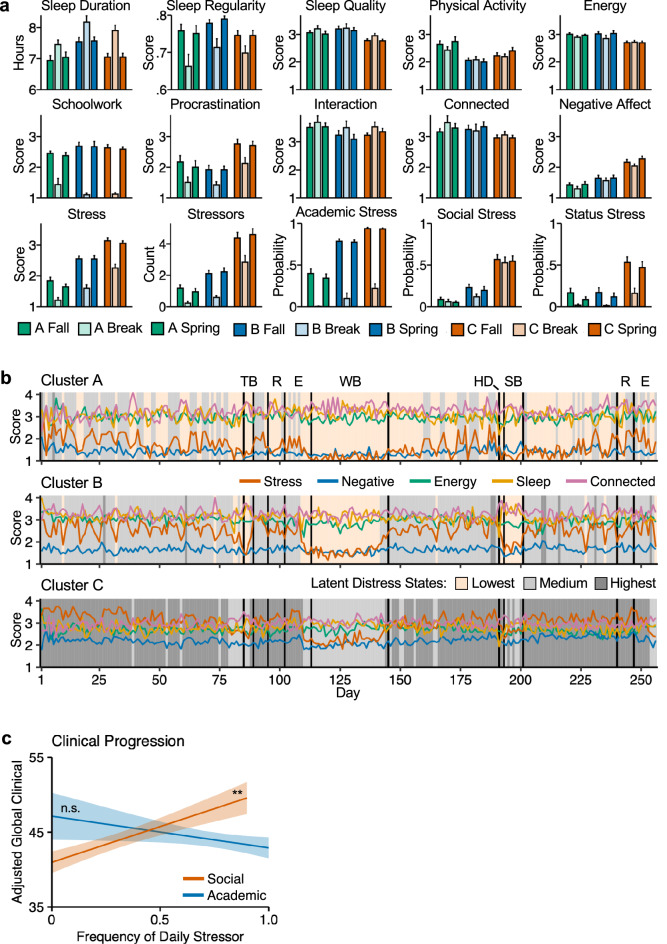
The three student profiles show distinct distress dynamics. (a) Bar plots show between-person means of each variable separately by student profile and by term. Error bars represent standard errors of the mean. (b) Sequence of most likely latent states of Distress for the three student profiles. TB thanksgiving break, R reading period, E exams period, WB winter break, HD housing day, SB spring break. (c) Frequency of Social stressors, but not Academic stressors, prospectively predicts subsequent global clinical symptoms. **Statistical significance at p < 0.01, n.s. not statistically significant (p > 0.05).

