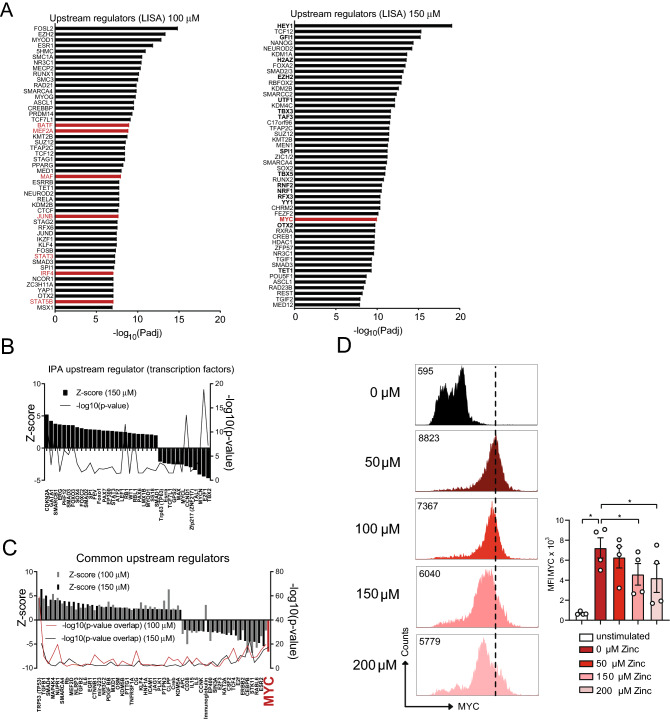
Figure 4.
High zinc concentrations inhibit MYC as a transcriptional regulator of metabolic gene expression in CD4+ T cells. (A) Upstream regulator anaylsis using Landscape in silico analysis (Lisa; http://lisa.cistrome.org/)31 of the RNA sequencing data from OT-II TCR tg CD4+ T cells in the presence of 100 μM or 150 μM zinc aspartate 24 h after activation. (B) Upstream regulators specific to OT-II TCR tg CD4+ T cells in the presence of 150 μM zinc aspartate identified by IPA. (C) Shared upstream regulators between OT-II TCR tg CD4+ T cells in the presence of 100 μM and 150 μM zinc aspartate identified by Ingenuity Pathway Analysis (IPA). (D) Histograms show nuclear MYC expression in OT-II CD4+ T cells activated for 24 h in the absence or presence of the indicated zinc concentrations. Graphs show cumulated data from 4 mice. RNA sequencing data (A–C) was generated in biological triplicates from 3 mice. Statistical analysis in (D) by one-way ANOVA followed by Tukey’s honestly significant difference (HSD) post hoc test for multiple comparisons. Data in (D) are from 4 mice. *p < 0.05, **p < 0.01, ***p < 0.001.

