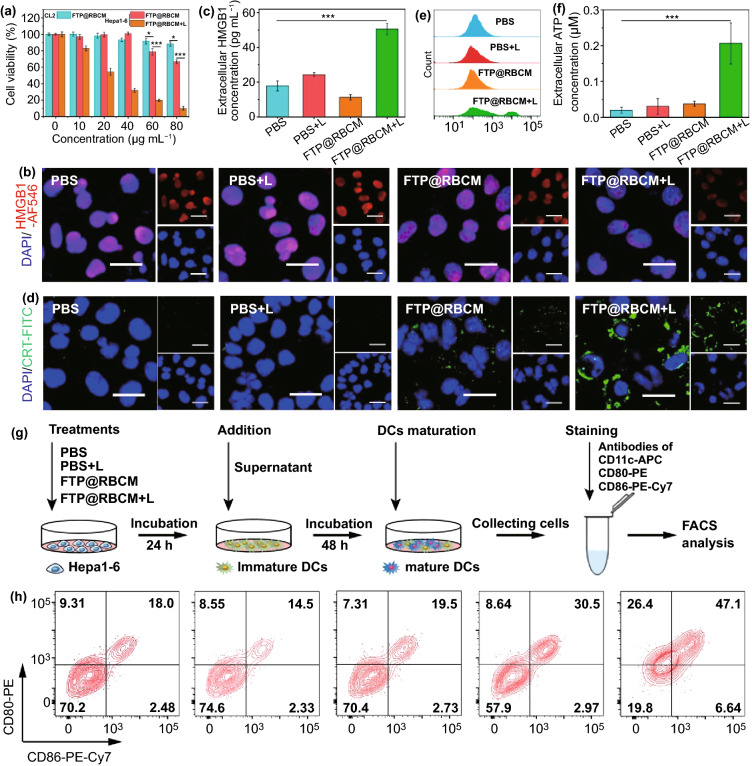
Fig. 4.
a Cell viabilities of CL2 and Hepa1-6 cells (n = 4). b CLSM images of HMGB1 immunofluorescence staining. Scale bar = 20 µm. c Extracellular HMGB1 levels (n = 3) d CLSM images of CRT immunofluorescence staining. Scale bar = 20 µm. e Flow cytometry analysis of CRT immunofluorescence staining. f Extracellular ATP levels (n = 3). g Schematic illustration of the experimental design and procedure of DC maturation assay in vitro. h DC maturation assay by flow cytometry

