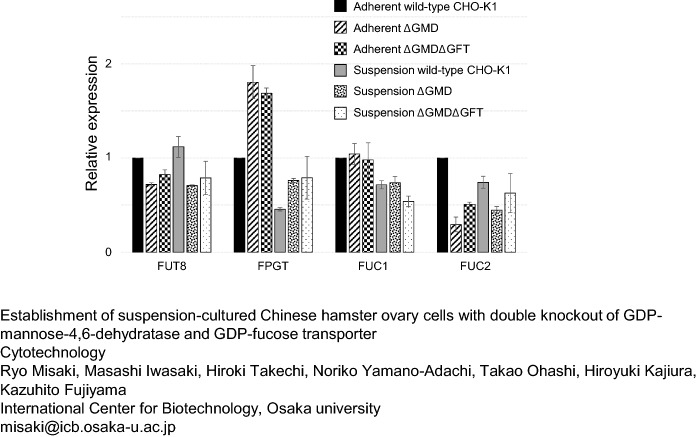
Fig. 5.
Relative gene expression of endogenous enzymes relating to the fucose metabolism. Bars mean adherent wild-type CHO-K1 cells, adherent ΔGMD cells, adherent ΔGMDΔGFT cells, suspension-cultured wild-type CHO-K1 cells, suspension-cultured ΔGMD cells, suspension-cultured ΔGMDΔGFT cells from the left, respectively. The expression amount of each gene from the wild-type CHO-K1 cells was normalized to 1. Mean (SE), n = 3

