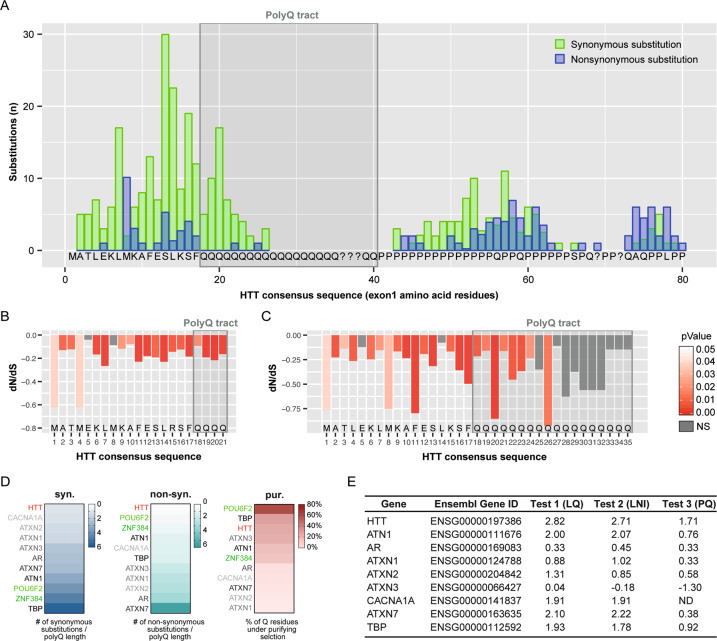
Fig. 1. Effects of natural selection on HTT exon1.
A Synonymous and non-synonymous substitutions counted with the codon-based maximum likelihood method SLAC on the multiple alignment of 163 unique, non-redundant sequences from vertebrates (n = 158), and basal species (n = 5). A time-tree was used as backbone for calculations. Synonymous (green) and non-synonymous (blue) substitution counts are shown for each codon (consensus sequence in the plot); the gray shaded box highlights the polyQ tract. B dN/dS ratios determined by FUBAR method for the multiple sequence alignment (MSA) subset of bony fishes, turtles, crocodiles, and birds (n = 84 species) where four glutamine-encoding codons can be unambiguously aligned. Consensus sequence of HTT exon1 is shown for reference; the gray shaded box highlights the polyQ (4Q) tract. C dN/dS ratios determined by FUBAR method for the MSA of mammals (Q ≥ 4, n = 74 species), where the number of Q encoding codons is variable. HTT N-terminal consensus sequence is shown for reference. The gray shaded box highlights the polyQ (Q ≥ 4) tract. The orientation of peaks in plots B and C indicates the direction of selection (downward = purifying/negative; upward = diversifying/positive); peaks height indicates the strength of selection (dN/dS values) and peak’s color (shades of red) shows the statistical significance level. D Heatmaps showing comparison of the polyQ stretch conservations for nine polyQ disease-associated genes (HTT in red, others in gray scale) and two genes not associated with any type of diseases (POU6F2 and ZNF384, green) across taxa. The heatmaps display the value of synonymous substitutions over Q length ratio (syn.), the value of non-synonymous substitutions over Q length ratio (non-syn.) and the fraction of Q residues under significative purifying selection (pur.). E Table showing the comparative analysis of the disease-associated polyQ proteins. Z-score values for the longest Q stretch (LQ), for the longest non-interrupted CAG interval (LNI) and for the CAG/CAA proportion (PQ) of the nine human disease-associated genes, extracted from the results of the three analyses (test 1, 2, and 3) described in Fig. S6B–D.

