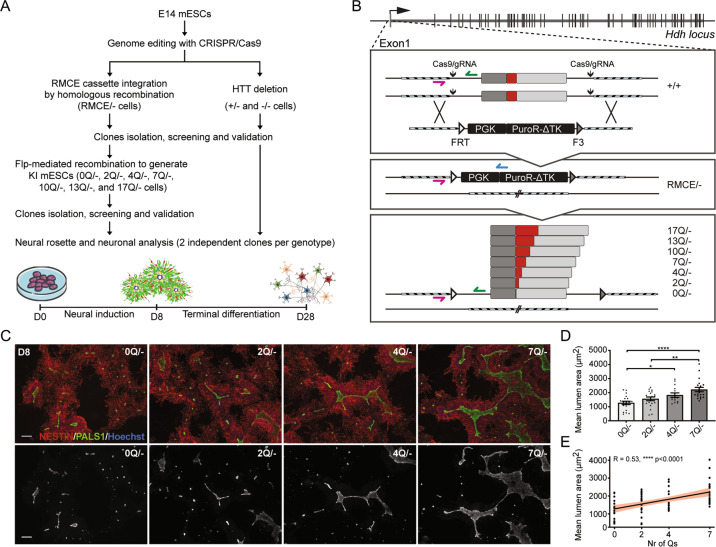
Fig. 3. PolyQ tract impacts the formation of neural structures.
A Pipeline for the generation and characterization of HTT knock-in and knock-out E14 mESCs. B Genome editing strategy used to produce knock-in mESCs. CRISPR/Cas9 with two gRNAs, was used to insert the RMCE cassette replacing the exon1 on one allele and to delete HTT exon1 on the other allele, thus generating the RMCE/− cell line. The RMCE cassette contains the positive/negative selectable marker PuroR-ΔTK, under PGK promoter, flanked by FRT and F3 recombination sites, which were used to direct the integration of modified exons 1 with 0, 2, 4, 7, 10, 13, and 17 Q repeats by Flp recombinase. gRNAs and oligos sequences are reported in Supplementary dataset S23. C Representative images of rosette/lumen phenotype in 0Q/−, 2Q/−, 4Q/−, and 7Q/− cells stained for PALS1 and NESTIN at day 8 of neural induction. D Mean lumen area (μm2) of 0Q/−, 2Q/−, 4Q/−, and 7Q/− cell cultures. *P < 0.05, **P < 0.01, ****P < 0.0001, one-way ANOVA test followed by Tukey. E Linear regression analysis and confidence interval between Q length and lumen size in 0Q/−, 2Q/−, 4Q/−, and 7Q/− cell cultures. Pearson correlation coefficients (R) and P-values are reported on the plots. Data in D and E are expressed as mean ± SEM from n ≥ 4 independent experiments. Each dot represents the mean lumen area per well testing a pool of two clones for each edited cell line (see Supplementary dataset S25 for raw data). The scale bars correspond to 50 μm.

