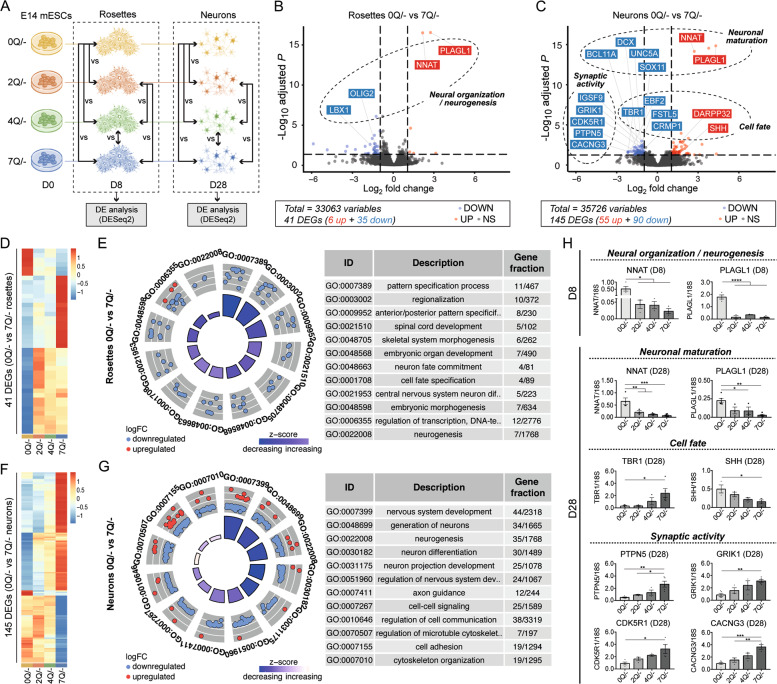
Fig. 5. RNA-seq analyses reveal the HTT polyQ-related molecular pathways underlying different signatures in the early-to-late generation of neurons among 0, 2, 4 and 7Q cell lines.
A Experimental scheme of gene expression analysis by RNAseq in which pairwise comparisons at rosette and neuron stage among 0, 2, 4, and 7Q (E14) cell lines were performed. B, C Volcano plots of DEGs between 0Q vs. 7Q at rosettes (B) and neuron (C) stage. Significant DEGs (adjusted P-value < 0.05) are labeled in red (for up-regulation with logFC > 1) or blue (for down-regulation with logFC < −1). The classes of genes subsequently validated by qPCR analysis are reported on the plot. D Heatmap of gene expression levels for significant DEGs between 0Q vs. 7Q rosettes (41 genes). The data was normalized and scaled. E Gene-ontology (GO) circle plot displaying the top significant (ranked on their P-value) non-redundant GO terms of the DEGs between rosettes 0Q vs. 7Q. Within each selected GO term the outer chart shows the distribution of the logFC of the individual assigned genes from higher (outer layer) to lower (inner layer). Genes are represented as red (upregulated) and blue (downregulated) circles. The height of the inner bars represents the P-value of the GO term whereas its color indicates the z-score (see “Methods” section). F Heatmap of gene expression levels for significant DEGs between 0Q vs. 7Q neurons (145 genes). The data was normalized and scaled. G GO circle plot displaying the top significant (ranked on their P-value) non-redundant GO terms of the DEGs between neurons 0Q vs. 7Q. For the details of the plot see E. H qPCR validation analyses of significant DEGs between 0Q vs. 7Q cell lines at rosette (D8) and neuron (D28) stage. Bar plots display the mean values ± SEM from n ≥ 3 biological replicates; *P < 0.05, **P < 0.01, ***P < 0.001, ****P < 0.0001, one-way ANOVA test followed by Tukey. Values of the logFCs are scaled. For the full lists of DEGs see Supplementary dataset S21.

