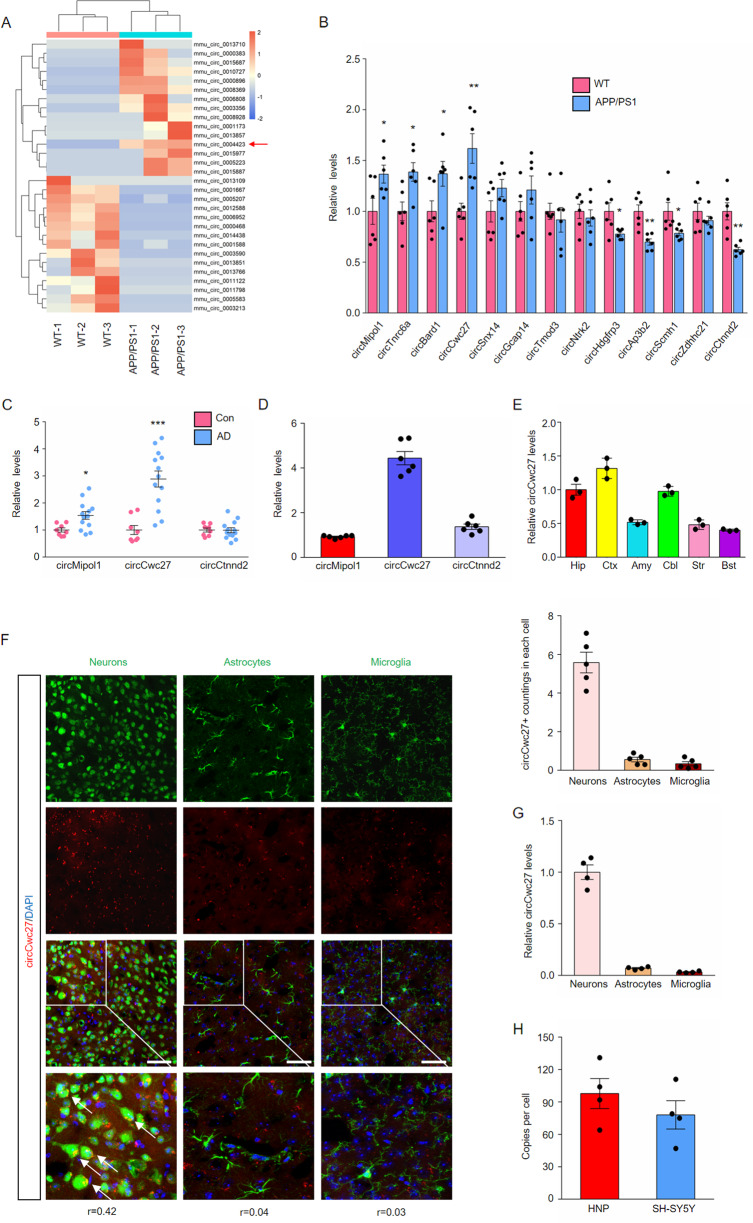
Fig. 1. CircCwc27 is a highly abundant and stable circRNA, that is upregulated in AD.
A A heatmap shows the top 15 most upregulated and top 15 most downregulated circRNAs in three samples of hippocampus from 6-month APP/PS1 vs WT mice by circRNA sequencing (orange color scale = higher expression. Blue color scale = lower expression. n = 3 samples/group. P value is determined by using Student’s t-test and corrected for multiple testing by using the Benjamini and Hochberg method). B qRT-PCR analysis was used to determine the expression levels of indicated circRNAs in the hippocampus from 6-month WT and APP/PS1 mice. n = 6. *P < 0.05, **P < 0.01 versus the WT group using Student’s t-test. C The expression of indicated circRNAs in the temporal cortex of healthy controls and AD patients were analyzed by qRT-PCR. n(Control) = 8, n(AD) = 13. *P < 0.05, ***P < 0.001 versus control group using Student’s t-test. D Comparing the relative abundance of indicated circRNAs in the hippocampus of WT mice by qRT-PCR. n = 6. E qRT-PCR was performed to determine the relative expression of circCwc27 in Hip (Hippocampus), Ctx (Cortex), Amy (Amygdala), Cbl (Cerebellum), Str (Striatum), Bst (Brainstem). n = 3. F BASE-scope in combination with immunostaining was performed to assess the colocalization between circCwc27 (red) and neurons (NeuN), astrocytes (GFAP), and microglia (Iba-1) in sections of cortex of APP/PS1 mice. The boxed areas were zoomed in the under panels. Nuclei were stained with DAPI (blue). The corresponding colocalization coefficients (Pearson’s R value) between circCwc27 and each cellular marker are shown in the merged images. The average circCwc27 + signal counts per neural cell are shown in the right. n = 5. Scar bar: 50 μm. G Relative expression of circCwc27 in day 14 mouse cortical neurons, astrocytes, and microglia was detected by qRT-PCR. n = 4. H Absolute quantification of circCwc27 copy number per cell, determined by qRT-PCR, in human neurons-hippocampal (HNP) and SH-SY5Y cells. Copy number was calculated from standard curves prepared from serial dilutions of circCwc27 oligonucleotide standards with known concentrations. n = 4. All data in the figure are shown as mean ± SEM.

