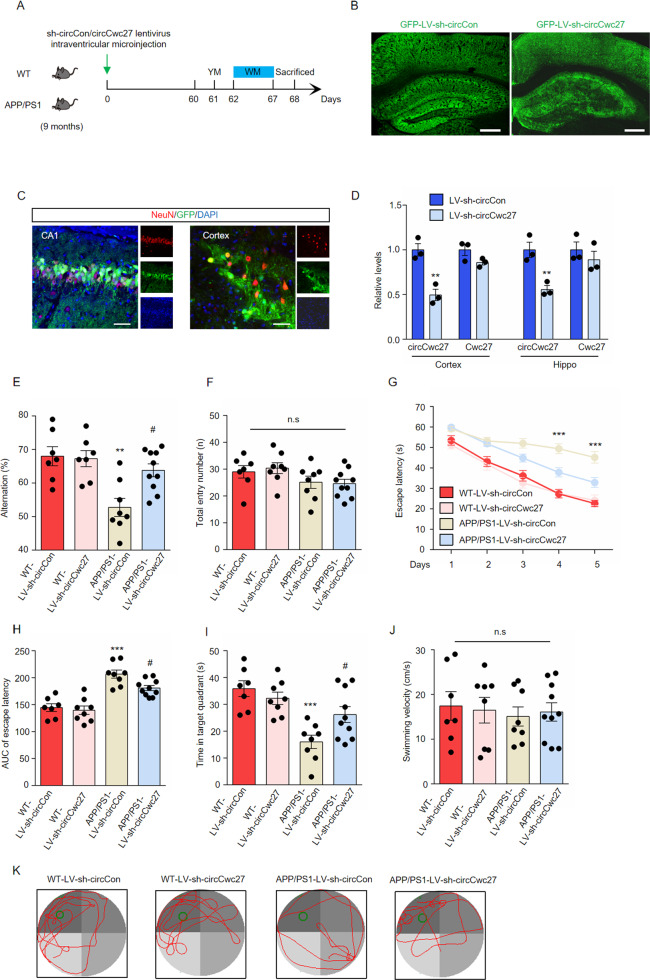
Fig. 2. Knockdown of circCwc27 improves spatial learning and memory in the APP/PS1 mouse model.
A Timeline of experimental procedure in our research. Spatial learning and memory ability were examined 60 days after lentivirus injection. B Confocal images of brain sections injected with lentivirus were shown, and GFP (green) was used to visualize viral diffusion. Scale bar, 200 μm. C Colocalization of NeuN (red) and GFP (green) in the CA1 region and cortex of injected mice. Nuclei were stained with DAPI (blue). Scale bar, 50 μm. D qRT-PCR was used to determine the expression of circCwc27 and Cwc27 in the cortex and hippocampus after LV-sh-circCon or LV-sh-circCwc27 injection. n = 3. **P < 0.01 versus corresponding LV-sh-circCon group. E, F Y maze spontaneous alternation behavioral test was performed in wild type (WT) or APP/PS1 mice 2 months after injection of either control LV-sh-circCon or LV-sh-circCwc27 (n = 7 mice for WT-sh-circCon, n = 8 mice for WT-sh-circCwc27, n = 8 mice for APP/PS1-sh-circCon, and n = 10 mice for APP/PS1-sh-circCwc27). The percentage of spontaneous alternations (E) and total entries (F) were measured. **P < 0.01 versus WT-LV-sh-circCon group; #P < 0.05 versus APP/PS1-LV-sh-circCon group. Data are analyzed with two-way ANOVA followed by Bonferroni test. G–K Morris water maze (MWM) task was carried out to assess spatial learning and memory of WT-sh-circCon (n = 7), WT-sh-circCwc27 (n = 8), APP/PS1-sh-circCon (n = 8), and APP/PS1-sh-circCwc27 (n = 10) mice. Data are analyzed with two-way ANOVA followed by Bonferroni test. G Latency to escape to a hidden platform in the MWM task during a 5-day training phase. Day4: APP/PS1-sh-circCwc27 vs. APP/PS1-sh-circCon; ***P < 0.001, Day5: APP/PS1-sh-circCwc27 vs. APP/PS1-sh-circCon; ***P < 0.001. H The area under the curve (AUC) of escape latency during the training phase. ***P < 0.001 versus WT-LV-sh-circCon group; #P < 0.05 versus APP/PS1-LV-sh-circCon group. I Probe trial was performed 24 h after the last training day and the time spent in the quadrant containing the hidden platform was recorded. ***P < 0.001 versus WT-LV-sh-circCon group; #P < 0.05 versus APP/PS1-LV-sh-circCon group. J The swimming velocity of each group was recorded in the probe trial. K Representative swimming trajectories from different group of mice were shown. The green circle represented the hidden platform. All data in the figure are shown as mean ± SEM.

