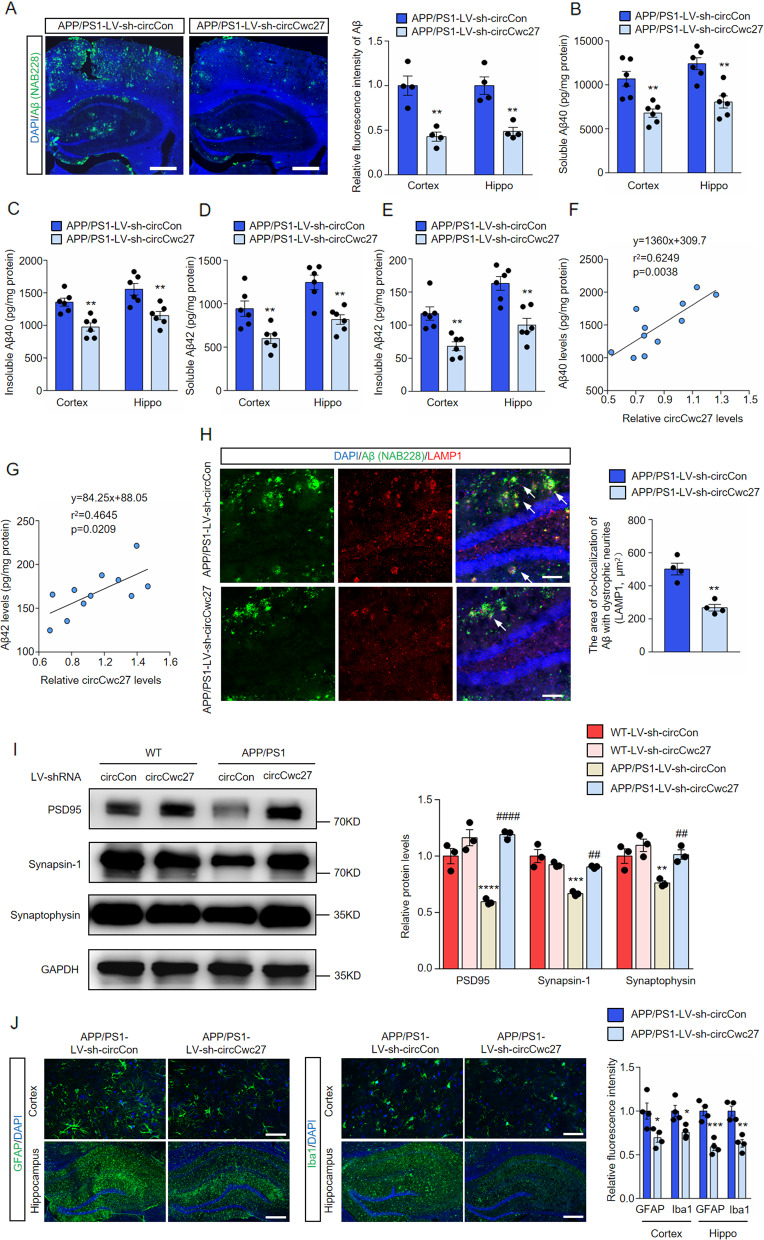
Fig. 3. Knockdown of circCwc27 improves AD pathology in APP/PS1 mice.
A Confocal images showing DAPI (blue) for nuclei, NAB228 (green) for an amyloid plaque in the cortex, and hippocampus from the APP/PS1 mice injected with LV-sh-circCon or LV-sh-circCwc27. Scar bar: 200 μm. Amyloid plaque deposition was quantified and normalized to APP/PS1-LV-sh-circCon group. n = 4. **P < 0.01 versus APP/PS1-LV-sh-circCon group using Student’s t-test. B–E Soluble and insoluble Aβ40 and Aβ42 levels in cortical and hippocampal tissues of APP/PS1-LV-sh-circCon or APP/PS1-LV-sh-circCwc27 injected mice were quantified by ELISA. n = 6. **P < 0.01 versus APP/PS1-LV-sh-circCon group using Student’s t-test. F The expression of Aβ40 and circCwc27 in the hippocampus of APP/PS1 mice were determined by ELISA and qRT-PCR, respectively. Scatter plot of Aβ40 versus circCwc27 levels was shown. The data were analyzed with a linear regression method. n = 11. G The expression of Aβ42 and circCwc27 in the hippocampus of APP/PS1 mice were determined by ELISA and qRT-PCR, respectively. Scatter plot of Aβ42 versus circCwc27 levels was shown. The data were analyzed with a linear regression method. n = 11. H Confocal images showing DAPI (blue) for nuclei, NAB228 (green) for an amyloid plaque, and LAMP1 (red) for dystrophic neurites in the hippocampus from the APP/PS1 mice injected with LV-sh-circCon or LV-sh-circCwc27. Scar bar: 50 μm. The area of Lamp1-positive dystrophic neurites in each plaque was quantified. n = 4. **P < 0.01 versus APP/PS1-LV-sh-circCon group using Student’s t-test. I Immunoblotting analysis and quantification of MAP2, PSD95, Synapsin-1, and Synaptophysin in cortex of mice injected with LV-sh-circCon or LV-sh-circCwc27. GAPDH was used as an inner control. n = 3. **P < 0.01, ***P < 0.001, ****P < 0.0001 versus WT-LV-sh-circCon group; ##P < 0.01, ####P < 0.0001 versus APP/PS1-LV-sh-circCon group. Data are analyzed with two-way ANOVA followed by Bonferroni test. J Representative immunofluorescence images and quantification of GFAP and Iba-1 in the cortex (upper row) and hippocampus (lower row) of APP/PS1 mice injected with LV-sh-circCon or LV-sh-circCwc27. Nuclei were stained with DAPI (blue). Scar bar: 50 μm for (upper row) and 200 μm for (lower row). n = 4. *P < 0.05, **P < 0.01, ***P < 0.001 versus APP/PS1-LV-sh-circCon group using Student’s t-test. All data in the figure are shown as mean ± SEM.

