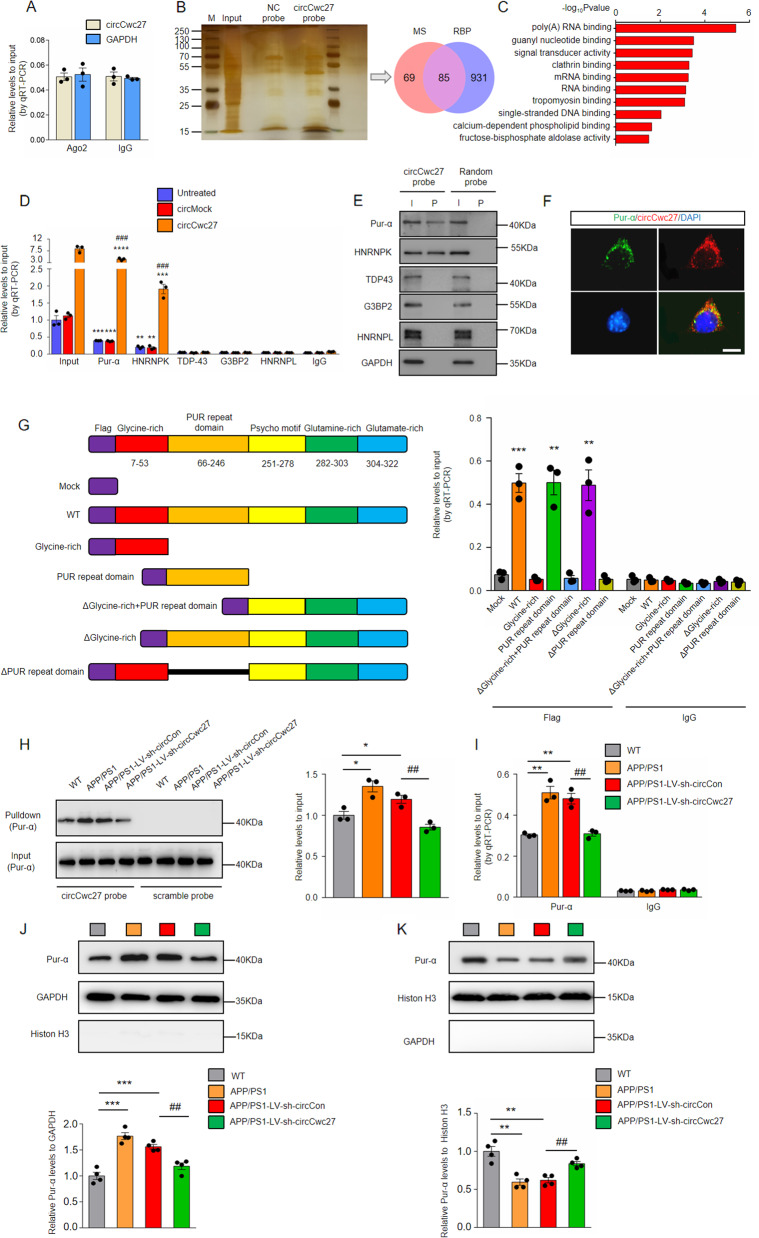
Fig. 4. CircCwc27 interacts with Pur-α protein and influences its distribution.
A RNA-binding protein immunoprecipitation (RIP) assays were carried out in SH-SY5Y cells using anti-AGO2 or IgG control antibodies, and circCwc27 levels were quantified using qRT-PCR. n = 3. Data were analyzed with Student’s t-test. B Silver staining followed by mass spectrometry assay was used to identify the circCwc27-protein complex pulled down by circCwc27 probe in protein extracts from hippocampus tissues of APP/PS1 mice. RNA-binding proteins (RBPs) were further identified according to RBPDB (http://rbpdb.ccbr.utoronto.ca). MS mass spectrometry, RBP RNA-binding protein. C GO functional categories of the proteins pulled down by circCwc27. D RIP and qRT-PCR assays were performed to assess the interaction of Pur-α, HNRNPK, TDP43, G3BP2, HNRNPL with circCwc27 in HEK293T cells that transfected with circMock or circCwc27. IgG was used as a negative control. n = 3. **P < 0.01, ***P < 0.001, ****P < 0.0001 versus IgG group; ###P < 0.001 versus circMock group using Student’s t-test. E Pur-α, HNRNPK, TDP-43, G3BP2, and HNRNPL levels were detected by immunoblotting after pulled down by circCwc27 probe or scramble probe in SH-SY5Y cells. The experiments were repeated three times independently with similar results. I input, P pulldown. F Confocal image showed that the endogenous circCwc27 (red) and Pur-α (green) were mainly bound in the cytoplasm in SH-SY5Y cells. Nuclei were stained with DAPI (blue). The experiments were repeated three times independently with similar results. Scar bar: 25 μm. G Left, a summary of Pur-α truncations. Right, relative enrichment of circCwc27 levels associated with WT or truncated Pur-α. IgG was used as a negative control. n = 3. **P < 0.01, ***P < 0.001 versus IgG group using Student’s t-test. H Immunoblotting assays were performed to assess Pur-α expression in the hippocampus of WT, APP/PS1, APP/PS1-LV-sh-circCon, and APP/PS1-LV-sh-circCwc27 mice following biotinylated circCwc27 probe pull-down assay. n = 3. *P < 0.05 versus WT group. ##P < 0.01 versus APP/PS1-LV-sh-circCon group. Data are analyzed with one-way ANOVA. I RIP and qRT-PCR assays were performed to assess the interaction of Pur-α with circCwc27 in the hippocampus of WT, APP/PS1, APP/PS1-LV-sh-circCon, and APP/PS1-LV-sh-circCwc27 mice. IgG was used as a negative control. n = 3. **P < 0.01 versus WT group. ##P < 0.01 versus APP/PS1-LV-sh-circCon group. Data are analyzed with one-way ANOVA. All data in the figure are shown as mean ± SEM. J, K Cytoplasmic and nuclear proteins were separated and the levels of Pur-α in the cytoplasm (J) and nucleus (K) were determined by immunoblotting. n = 4. **P < 0.01, ***P < 0.001 versus WT group. ##P < 0.01 versus APP/PS1-LV-sh-circCon group. Data are analyzed with one-way ANOVA.

