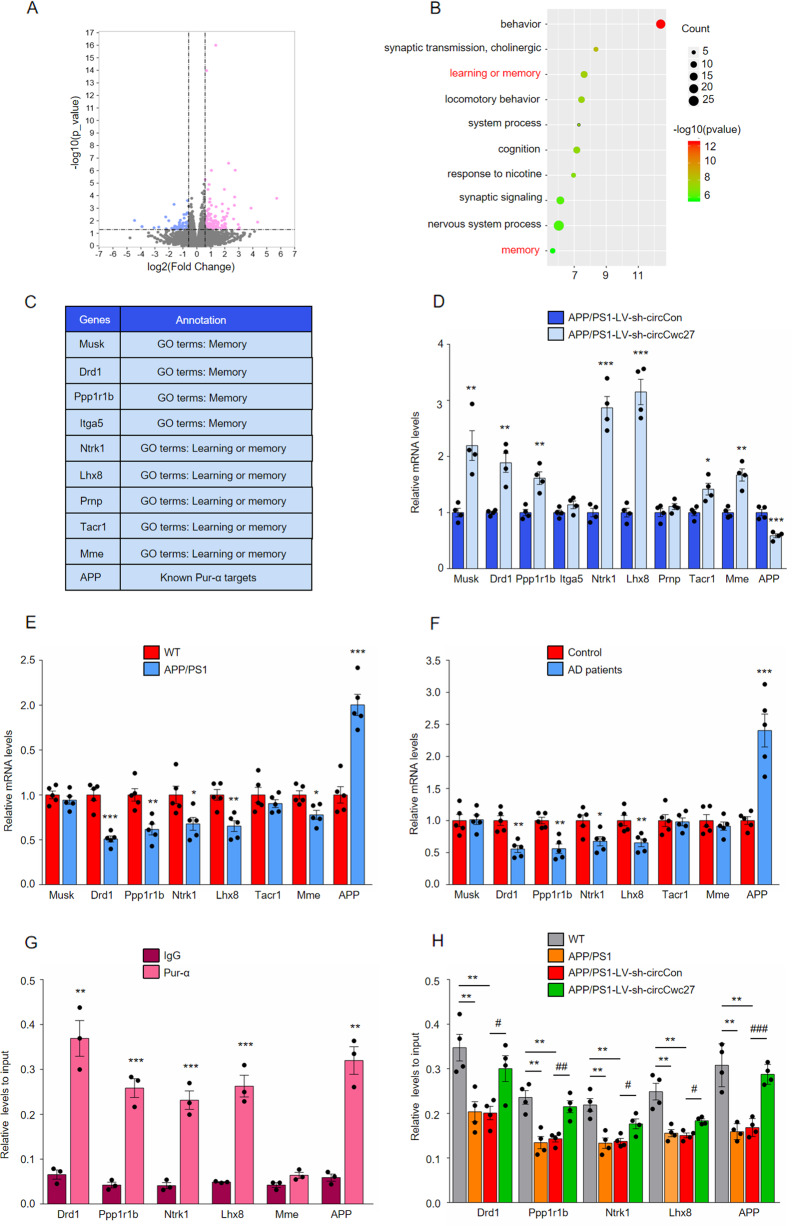
Fig. 6. CircCwc27 regulates AD genes transcription by binding to Pur-α.
A Volcano plots indicate the differentially expressed mRNAs in the hippocampus of APP/PS1-LV-sh-circCwc27 vs APP/PS1-LV-sh-circCon mice (x-axis = relative to APP/PS1-LV-sh-circCon mice log2 fold changes; y-axis: negative log10 of the P values. Vertical lines represent >1.5-fold changes, and the horizontal line represents P < 0.05). B Gene ontology (GO) annotation of differentially expressed genes in the hippocampus of APP/PS1-LV-sh-circCwc27 vs APP/PS1-LV-sh-circCon mice. Top 10 GO biological process terms are shown. The size of circle represents the number of enriched genes. The larger the circle, the more genes are enriched. The color depth indicates the enrichment degree. Red color = higher expression. Green color = lower expression. C List of genes enriched in “learning and memory” as well as “memory” categories in Gene Ontology (GO) annotation in B and known Pur-α targets that were differentially expressed in the hippocampus of APP/PS1-LV-sh-circCwc27 versus APP/PS1-LV-sh-circCon mice. D qRT-PCR analysis was used to determine the expression levels of mRNAs in the hippocampus from APP/PS1-LV-sh-circCon and APP/PS1-LV-sh-circCwc27 mice. n = 4. *P < 0.05, **P < 0.01, ***P < 0.001 versus the APP/PS1-LV-sh-circCon group using Student’s t-test. E qRT-PCR analysis was used to determine the expression levels of mRNAs in the hippocampus from 9-month WT and APP/PS1 mice. n = 5. *P < 0.05, **P < 0.01, ***P < 0.001 versus the WT group using Student’s t-test. F The expression of indicated mRNAs in the temporal cortex of healthy controls and AD patients were analyzed by qRT-PCR. n = 5. *P < 0.05, **P < 0.01, ***P < 0.001 versus control group using Student’s t-test. G ChIP-qPCR assays were performed to assess the enrichment of Pur-α on promoters of genes in SH-SY5Y cells. Expression of each gene was changed by circRNA knockdown as well as in APP/PS1 mice and AD patients. n = 3. **P < 0.01, ***P < 0.001 versus IgG group using Student’s t-test. H ChIP-qPCR assays were performed to assess the enrichment of Pur-α on genes promoter in the hippocampus of WT, APP/PS1, APP/PS1-LV-sh-circCon, and APP/PS1-LV-sh-circCwc27 mice. n = 4. **P < 0.01 versus WT group. #P < 0.05, ##P < 0.01, ###P < 0.001 versus APP/PS1-LV-sh-circCon group. Data are analyzed with one-way ANOVA. All data in the figure are shown as mean ± SEM.

