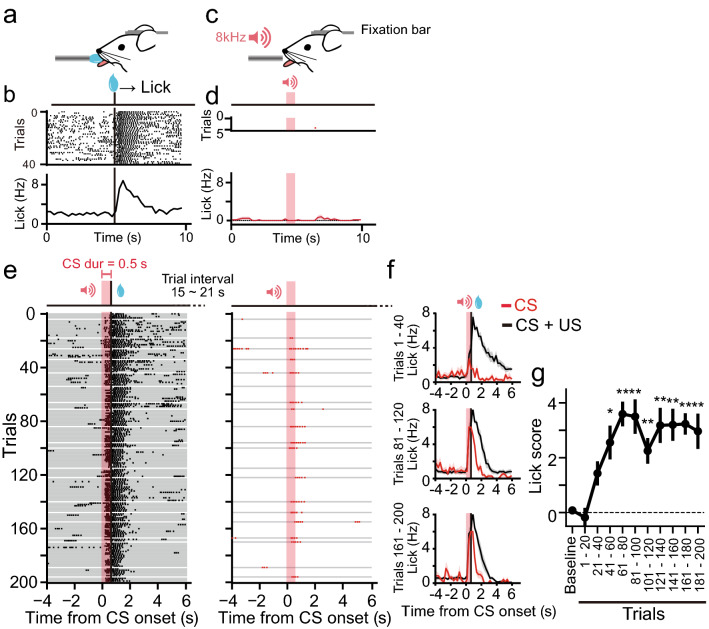
Figure 1.
Pavlovian conditioning in head-restrained mice. (a) A schematic diagram of the behavioural setup. Mice were head-restrained using a chronically implanted bar. A drop of glucose water was presented as an US to directly touch the mouth of the mouse from a tube that monitored the licking responses. (b) Raster plots (upper) and an averaged peristimulus time histogram (PSTH, bottom) for the licking responses to US presentation from a representative mouse. The US was presented 40 times at 10-s intervals. Black vertical bars indicate the onset of US presentation. (c) A short tone (8 kHz, 70 dB, 0.5 s) presentation without US. (d) Raster plots (upper) and an averaged PSTH (bottom, n = 7 mice) for licking responses to CS before conditioning. The baseline measurement consisted of five consecutive trials with CS-only presentation. Red shades indicate the period of CS presentation. (e) Raster plots for licking during conditioning with a CS duration of 0.5 s in a representative mouse. The session consisted of 180 trials with a paired presentation of CS and US (left) and pseudo-randomly inserted 20 trials with CS-only presentation (right). “CS dur” indicates the duration of CS presentation. US was presented at the offset of CS. Intervals between CS presentations were pseudo-randomly varied between 15 and 21 s. Each gray line indicates a single trial. (f) Averaged PSTHs for the licking responses in the first 20% of the trials (1–40, upper), the third 20% of the trials (81–120, middle), or the last 20% of the trials (161–200, bottom) during CS + US trials (black trace) or CS-only trials (red trace). In the CS-only trials, the average of four trials was included in the indicated periods are shown. The shadows indicate SEM. n = 7 mice. (g) Lick scores (“Methods”) plotted against time. *P < 0.05, **P < 0.01 (n = 7 mice, Kruskal–Wallis test). Error bars indicate SEM.

