Figure 4.
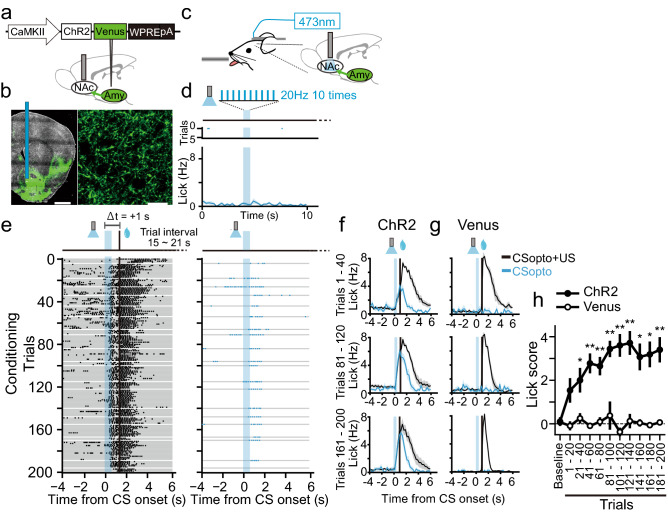
Pavlovian conditioning with CSopto. (a) A viral construct and schematic of the AAV injection and optical fibre implantation. ChR2-expressing AAV was injected into the left basolateral amygdala (BLA). An optical cannula (200 μm core) was placed into the left NAc. (b) Macroscopic (left) and microscopic (right) confocal images of the green fluorescence of Venus fused with ChR2 in the NAc. A blue vertical bar indicates the tract of the inserted optical cannula. Scale bars indicate 1 mm (left) and 20 μm (right). (c) Schematic of the behavioural setup. The optical cannula was connected to a laser (473 nm) by a patch cable. (d) Representative licking responses before conditioning in response to ChR2 stimulation (CSopto, 20 Hz, ten times, 5 ms pulse width). Raster plots indicating licking responses from a representative mouse and PSTHs indicating averaged responses over ten mice. Blue shades indicate the period of CSopto presentation. (e) Representative licking responses during CSopto conditioning with Δt = + 1 s. The conditioning paradigm was the same as Fig. 1 except that the tone was replaced with CSopto, and the delay was 1 s. Raster plots indicating licking responses from CS + US trials (left) or CS-only trials (right). Each gray bar indicates a single trial. Black vertical bars indicate the onset of US presentation. (f,g) Averaged PSTHs for the licking responses in the first 20% of the trials (1–40, upper), the third 20% of the trials (81–120, middle), or the last 20% of the trials (161–200, bottom) for each of the CS + US trials (black trace) or the CS-only trials (blue trace) from mice injected with ChR2 (f, n = 10) or Venus (g, n = 4). Shadows indicate SEM. (h) Lick scores (“Methods”) plotted against time course for the ChR2 mice (n = 7) and Venus mice (n = 4). Kruskal–Wallis test. *P < 0.05, **P < 0.01. Error bars indicate SEM.

