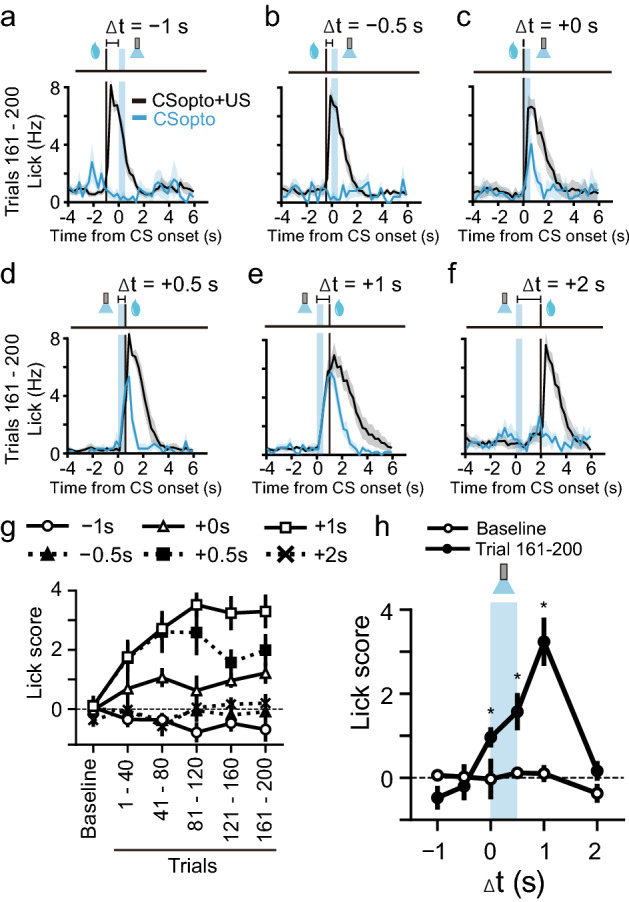
Figure 5.

Various delays in US for CSopto conditioning. (a–f) Averaged PSTHs of the licking responses in conditioning with delays of Δt = − 1 s (a, n = 5 mice), Δt = − 0.5 s (b, n = 5 mice), Δt = + 0 s (c, n = 5 mice), Δt = + 0.5 s (d, n = 6 mice), Δt = + 1 s (e, n = 10 mice), and Δt = + 2 s (f, n = 5 mice) during 161–200 trials. (e) is the same plot as the bottom trace of Fig. 4f. (g) Lick scores plotted against time course for each condition. (h) Time window for conditioning. Lick scores in test trials or eight trials during trials 161–200 were plotted against delays between the CS and US. Wilcoxon signed-rank test. *P < 0.05.
