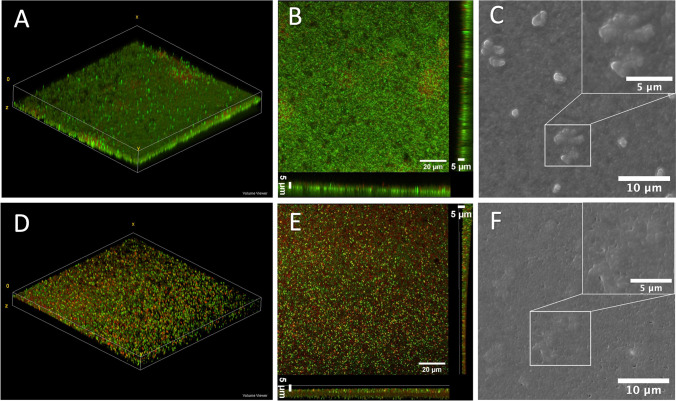
Fig. 4.
Morphology of biofilms grown under ALI (A–C) and LLI (D–F) interfaces: A and D representative 3D reconstruction of z-stack CLSM images. B and E 3D projected and orthoclase views of z-stacks obtained from the CLSM images. The live bacteria were stained with SYTO9 (green), and dead bacteria were stained red-fluorescent propidium iodide. C and F Representative SEM images of PAO1 biofilms showing the “dome-shaped” aggregates; the upper right corner is magnified “dome-shaped” aggregates

