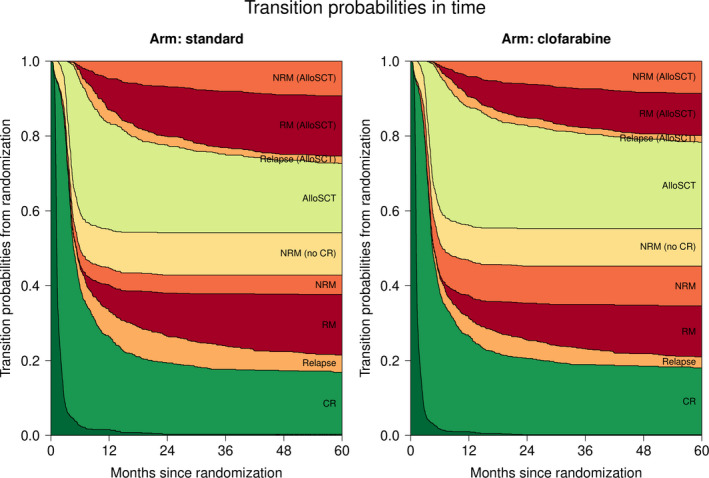
FIGURE 3.

Transition probabilities to all states from randomization: Transition probabilities derived from the multi‐state model (see Figure 1). At each point in time, the distance between two adjacent curves represents the probability of being in the corresponding state, conditional on being in state “Randomization” at time 0. The probability of being in an intermediate state can both increase and decrease over time, while the probability of absorbing (death) states can only increase over time. Transition probabilities (plus 95% CI) at 24 and 60 months since randomization are listed in supplemental Table S3. AlloSCT, allogeneic stem cell transplantation, CR, complete remission, NRM, non‐relapse mortality, RM, relapse mortality (all mortality taking place after relapse).
