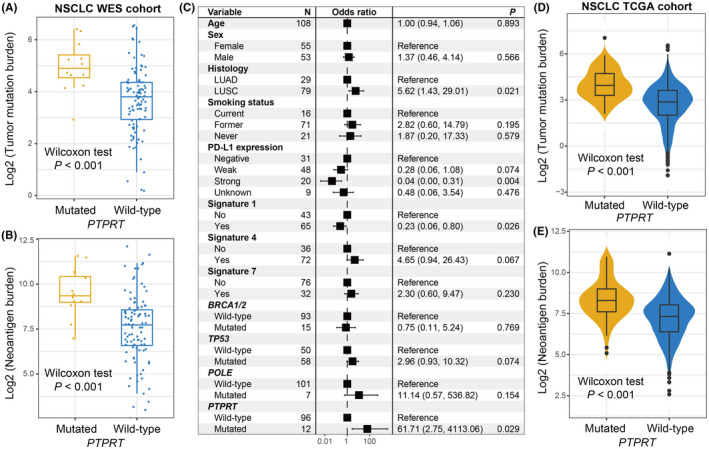
FIGURE 6.

PTPRT mutations association with mutational burden in NSCLC. Distribution of (A) TMB and (B) NB in distinct PTPRT subgroups in the pooled NSCLC WES cohort. (C) Multivariate regression model underlying the association between PTPRT mutations and TMB with clinical features, extracted mutational signatures, and genome repair gene mutations taken into account to adjust confounders. Distribution of (D) TMB and (E) NB in distinct PTPRT subgroups in the TCGA NSCLC cohort
