
FIGURE 2.
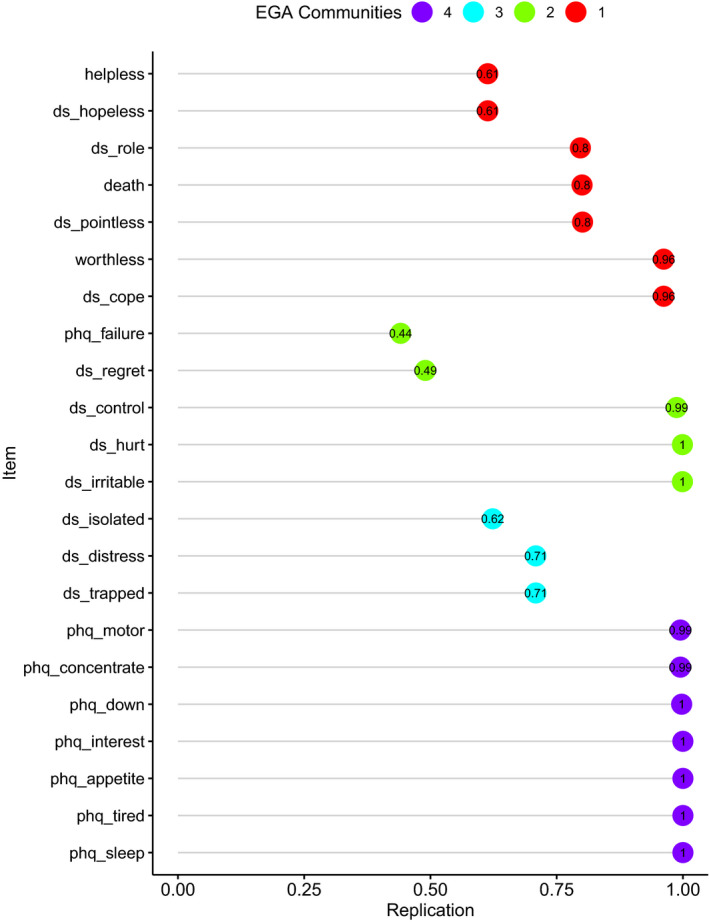
Probability of each symptom belonging to the community it was originally identified in by EGA (results from bootstrap with 10,000 iterations)
Official websites use .gov
A
.gov website belongs to an official
government organization in the United States.
Secure .gov websites use HTTPS
A lock (
) or https:// means you've safely
connected to the .gov website. Share sensitive
information only on official, secure websites.
Probability of each symptom belonging to the community it was originally identified in by EGA (results from bootstrap with 10,000 iterations)