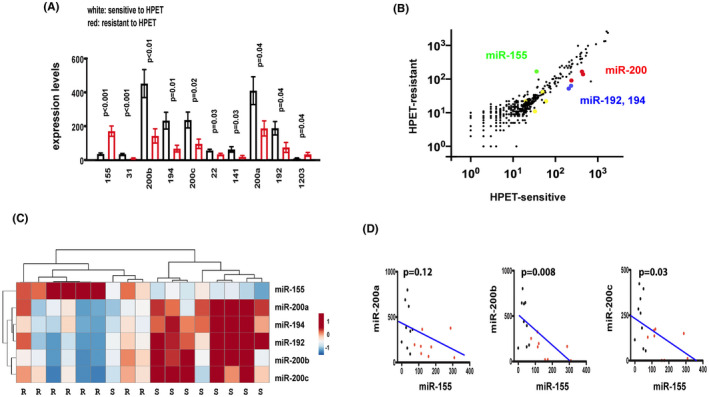
FIGURE 1.

In gastric diffuse large B‐cell lymphomas treated with H. pylori eradication therapy, the resistant group had higher levels of miR‐155 but lower levels of miR‐200 than the sensitive group. (A) The sensitive group had lower levels of miR‐155 and higher levels of miR‐200 than the resistant group. The NanoString technology is used to determine the levels of 654 miRNAs in 9 sensitive and 8 resistant cases. MiR‐155 is the only miRNA increased in the resistant group and miR‐200 a, b, and c are the most abundant miRNAs increased in the sensitive group. X‐axis: Ten miRNAs that are differentially expressed in the sensitive versus the resistant group. Y‐axis: mean expression levels. White: sensitive to HPET; Red: resistant to HPET. HPET: H. pylori eradication therapy. (B) Scatter plot for the expression levels of 654 miRNAs in gastric diffuse large B‐cell lymphomas. Most miRNAs had similar levels in the sensitive and resistant groups and are clustered along the x = y diagonal. Of the 10 differentially expressed miRNAs, miR‐155 (green) is above the diagonal and miR‐200 a, b, c (red), miR‐192, and miR‐194 (blue) are below the diagonal. The remaining four minor miRNAs, 31, 22, 141, and 1203 are represented by the yellow dots. X‐axis: sensitive to H. pylori eradication therapy; Y‐axis: resistant to H. pylori eradication therapy. (C) Hierarchical clustering of gastric diffuse large B‐cell lymphomas with miR‐155, miR‐200, miR‐192, and miR‐194. The sensitive cluster on the left included one resistant plus eight sensitive cases. The resistant cluster on the right included eight resistant cases. (D) An inverse correlation between miR‐155 and miR‐200 a, b, or c. The correlation coefficient between miR‐155 and miR‐200 a, b, or c, is −0.53, −0.63, and −0.58, respectively. X‐axis: level of miR‐155; Y‐axis: levels of miR‐200 a, b, or c
