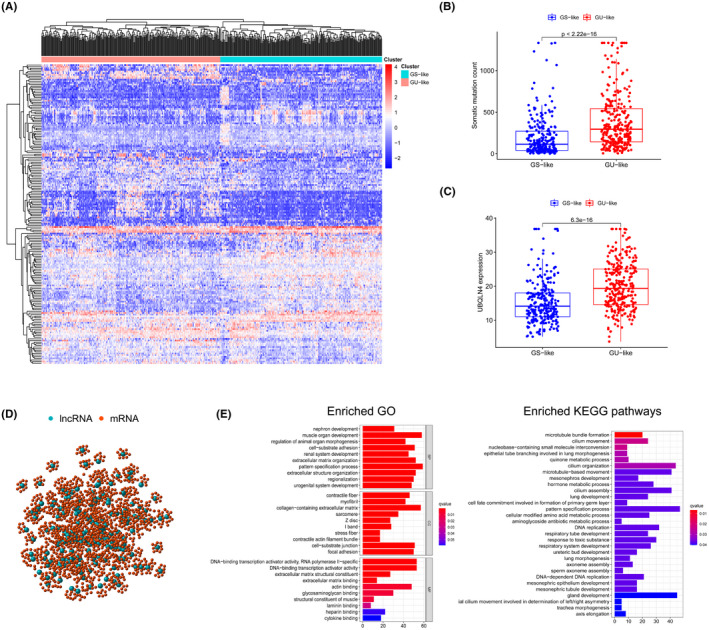
FIGURE 2.

Identification of lncRNAs linked to genomic instability in LUAD patients and further functional enrichment analysis. (A) Unsupervised clustering dependent on the 185 selected genomic instability‐related lncRNAs’ expression trend in 490 LUAD patients. The left red cluster represents the GU‐like group, while the GS‐like group is reflected by blue cluster on the right. (B) Boxplots of somatic mutation counts. The total number of somatic mutations was markedly different between the two groups. For statistical study, the Mann‐Whitney U test was used. Median values were reflected by the horizontal points. (C) Boxplots of the UBQLN4 level in both groups. The UBQLN4 level was obviously lower in the GS‐like group than in the other group. (D) Co‐expression network on the basis of the Pearson correlation coefficient analysis of genomic instability‐associated lncRNAs and mRNAs. LncRNAs are described by red circles, and mRNAs are represented by blue circles. (E) GO and KEGG functional enrichment study for co‐expressed mRNAs
