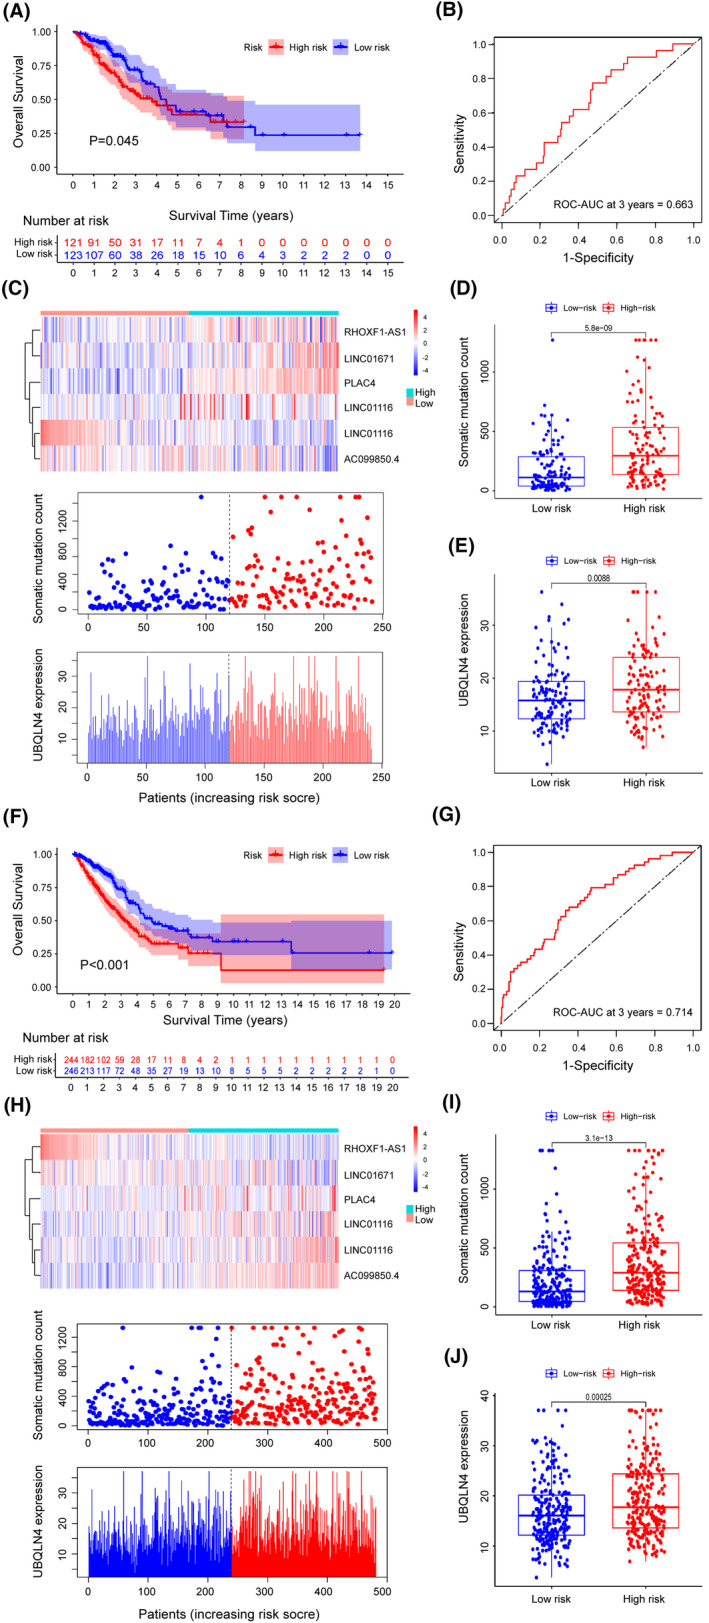
FIGURE 4.

Evaluation of the GILncSig performance in the testing and the TCGA sets. (A) Estimates of OS by Kaplan‐Meier in the testing set for low‐ or high‐risk patients. (B) Analysis of ROC curves dependent on time and AUC for 3‐year OS in the testing set for the GILncSig. (C) LncRNA expression patterns, somatic mutation number's distribution and the UBQLN4 expression's distribution for LUAD samples in the testing set. (D) Distribution of somatic mutations for patients with LUAD in two risk groups of the testing set. (E) UBQLN4 expression levels in the two groups with different risks. (F) Kaplan–Meier estimates of OS of two risk groups in the TCGA set. Analysis of statistics was carried out with univariate Cox regression and the log‐rank test. (G) Analysis of ROC curves dependent on time and AUC for 3‐year OS in the whole TCGA set. (H) LncRNA expression patterns, somatic mutation number's distribution and the UBQLN4 expression's distribution for samples in the TCGA set. (I) Distribution of somatic mutations in two risk groups of samples from the TCGA set. (J) UBQLN4 levels in the two groups in the TCGA set. Median values were reflected by the horizontal points. The Mann‐Whitney U test was carried out to complete the statistical analysis
