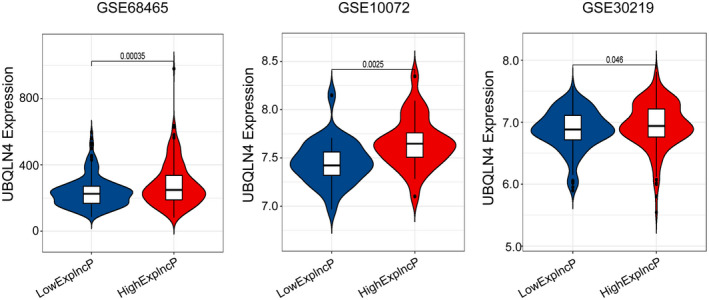
FIGURE 5.

Evaluation of the GILncSig performance in other three separate GEO data sets. Violin plots for the expression levels of UBQLN4 among patients with low and high PLAC4 expression. The Mann‐Whitney U test was conducted to compare that between two different risk groups
