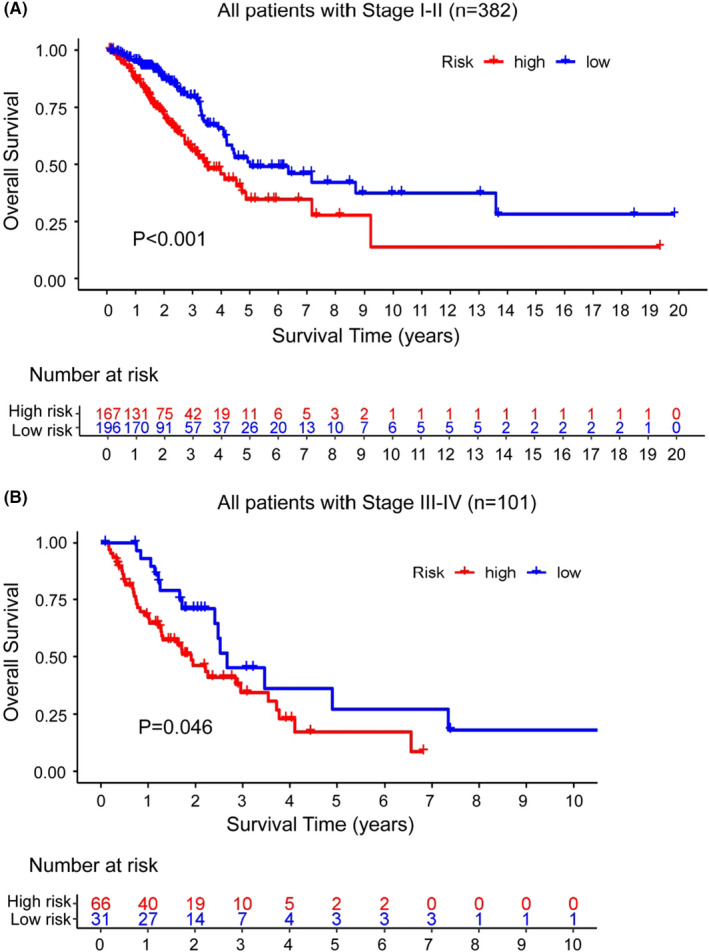
FIGURE 7.

Analyses of stratification by stage. Analyses of OS of two groups with different risks in the early‐stage group (A) and the late‐stage group (B) using Kaplan–Meier curve method. The log‐rank test and univariate Cox analysis were used to do the statistical analysis
