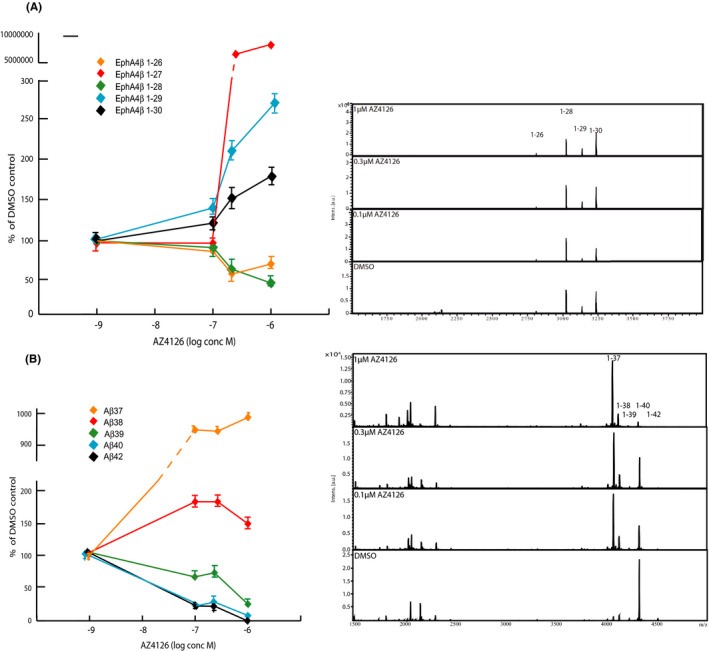
FIGURE 6.

Dose‐dependent treatment with AZ4126 on FLAG‐EphA4‐ΔE and APPswe cells. (A) Schematic graph and representative MALDI‐TOF MS spectrum of showing secreted Aβ‐like peptides from HEK293 cells stably expressing FLAG‐A4ΔE treated with DMSO (control) and three concentrations of AZ4126 (1, 0.3 and 0.1 µM). (B) Schematic graph and representative MALDI‐TOF MS spectrum of showing secreted Aβ peptides from HEK293 cells stably expressing APPswe treated with DMSO (control) and three concentrations of AZ4126 (1, 0.3 and 0.1 µM). The graphs represent the means of two experiments (N = 2) in triplicate (n = 3) with error bars indicating SEM
