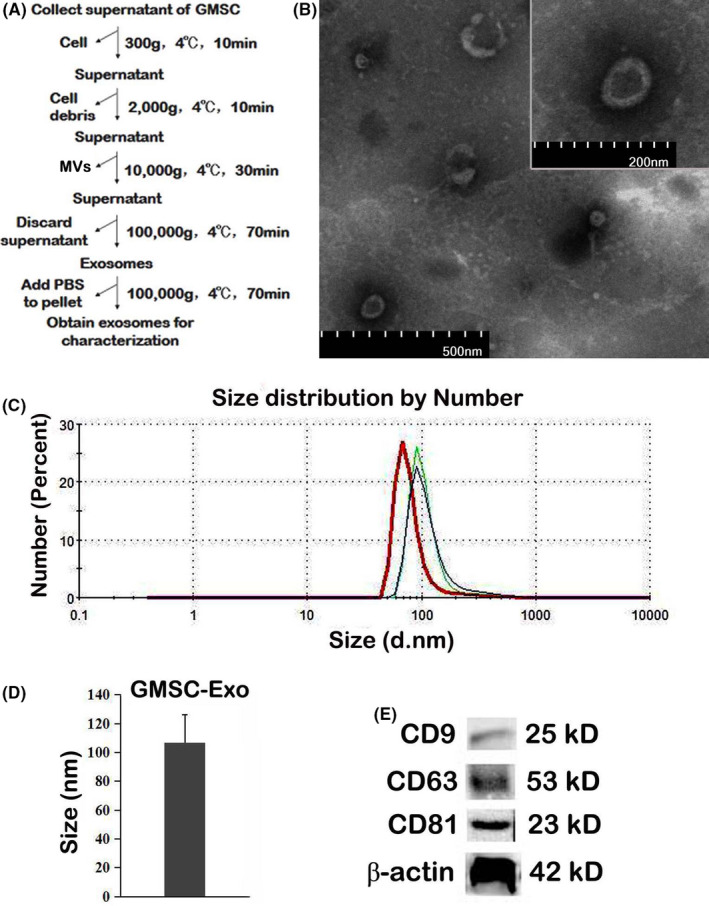
FIGURE 2.

Isolation and characterization of GMSC‐Exo. (A) Experimental protocol for isolation of exosomes from GMSC‐conditioned medium using differential ultracentrifugation. (B) Representative images of GMSC‐Exo by TEM. Bars represent 500 nm in large picture and 200 nm for insert. (C) Number and size of GMSC‐Exo detected by nanoparticle tracking analysis. The analysis demonstrates that GMSC‐Exo have a single peak (~100 nm) diameter, and the mean diameter is 107 nm. (D) Mean size of GMSC‐Exo in the fractions represented in (C) (n = 3 biological replicates). (E) Detection of exosomal marker (CD9, CD63 and CD81) expression in purified GMSC‐Exo by Western blot. GMSC‐Exo, gingival mesenchymal stem cell‐derived exosomes; TEM, transmission electron microscopy
