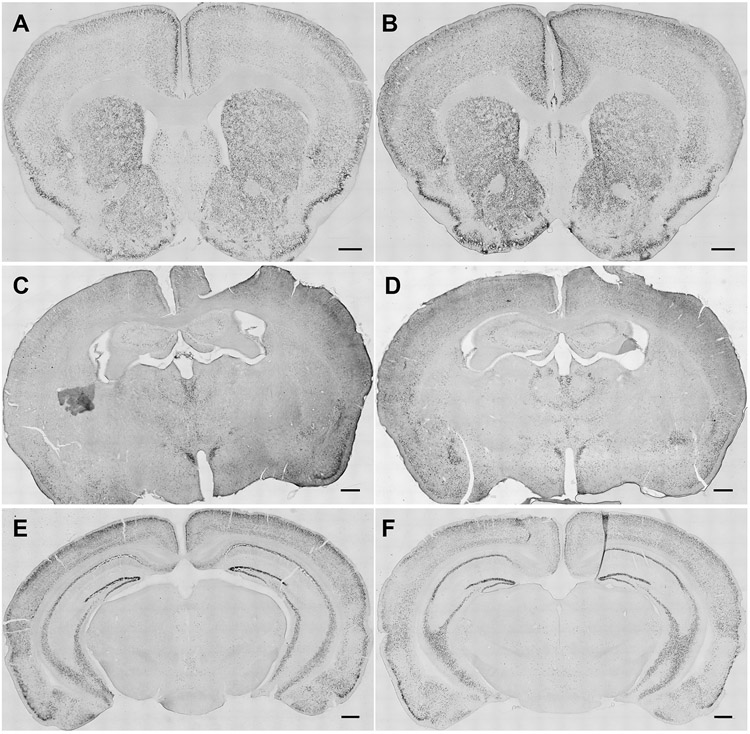
Fig. 6. Representative photomicrographs show impact of oxycodone consumption and naloxone challenge on ΔFosB-expressing cells in the NAc, amygdala and VTA.

Representative images show distribution of ΔFosB staining in coronal sections at the level of the NAc, amygdala and VTA derived from A, C, E) water- and B, D, F) oxycodone-consuming mice respectively. The scale bar equals 500 μm. (Nucleus accumbens – NAc, Basolateral amygdalar nucleus - BLA, Central amygdalar nucleus capsular part – CeC, Ventral tegmental area - VTA)
