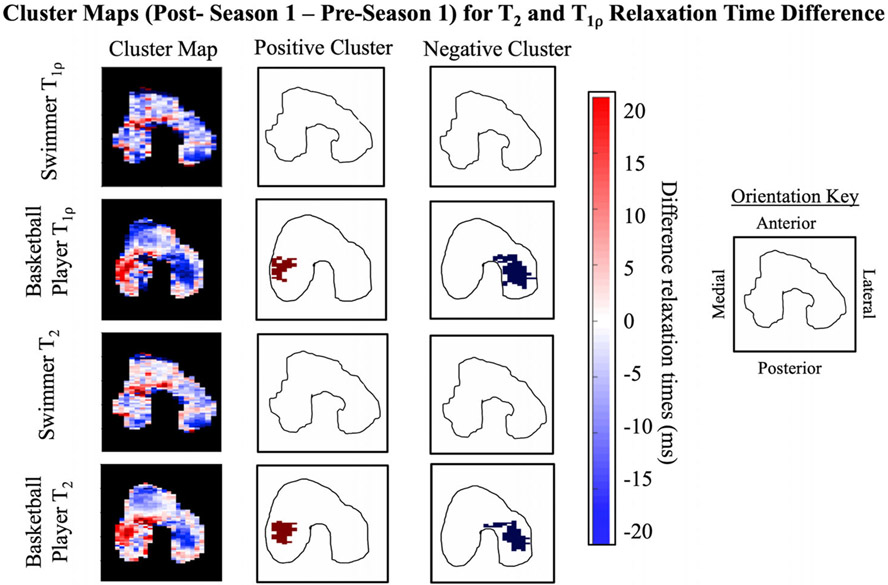
Figure 5:
Cluster analysis maps from a representative basketball player and swimmer. Positive and negative cluster maps shown are after the intensity and size thresholds had been applied. The cluster analysis of the femoral cartilage shows a basketball player with significant positive clusters in the medial central compartment and significant negative clusters in the lateral central compartment compared to a swimmer with no significant positive or negative clusters.

