Fig. 1.
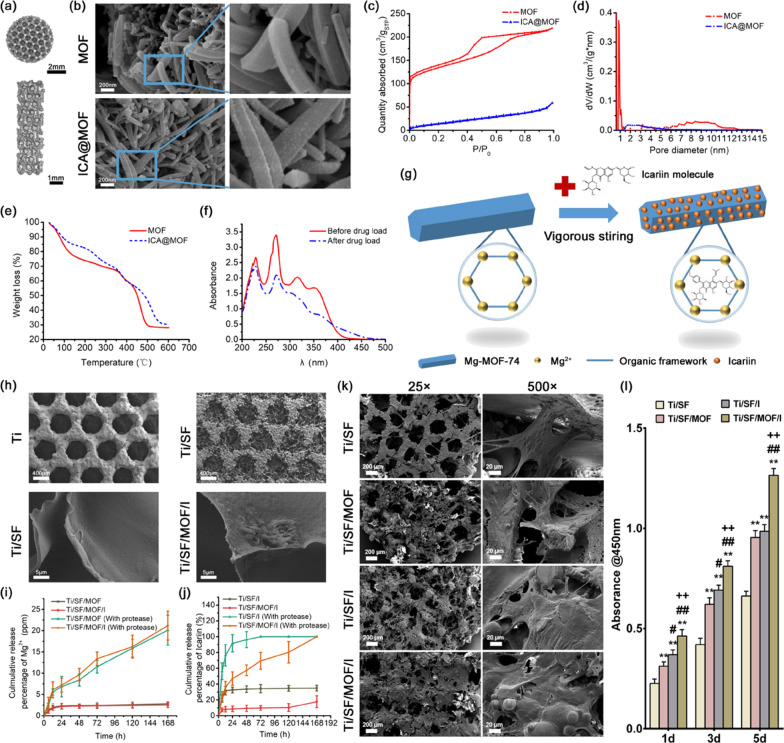
Characterization and biocompatibility of different samples. a Different sizes of 3D-printed PT scaffolds. b The morphology of MOF before and after icariin-loading. c N2 physisorption isotherms of MOF before and after icariin-loading. d The pore size distribution of MOF before and after icariin-loading. e The thermogravimetric analysis results of the MOF before and after icariin-loading. f UV–vis absorption spectra of the icariin solution before and after MOF loading. g Schematic diagram of the icariin loading process of MOF. h The microscopic morphology of the different samples by SEM. i, j Icariin release curve and Mg2+ release curve of each group of biofunctionalized PT scaffolds in protease-free and protease-included PBS for different time periods. k Adhesion morphology of rBMSCs on each group of scaffolds. l The CCK-8 assay assesses the proliferation of Raw264.7 cells on porous scaffolds. (n = 3; *, # and + represent P < 0.05 when compared with Ti/SF, Ti/SF/MOF and Ti/SF/I, respectively; **, ## and ++ represent P < 0.01)

