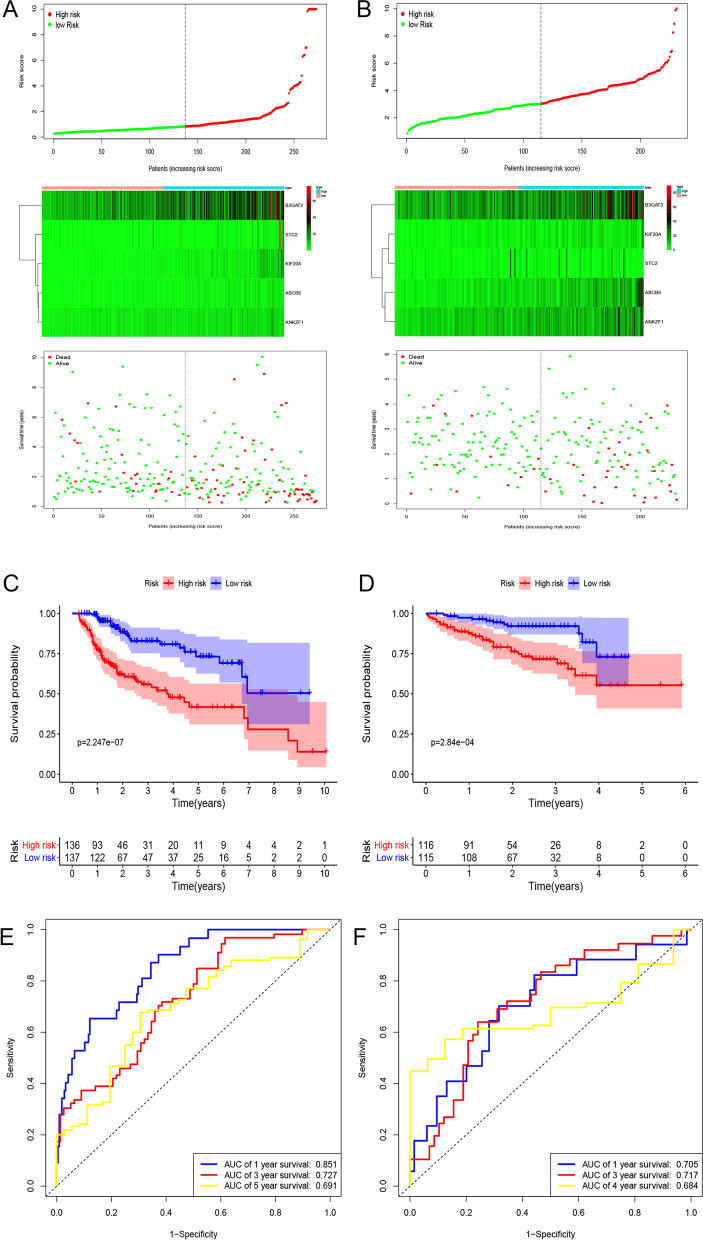
Fig. 2.
Risk score distribution, Kaplan-Meier analysis and time-dependent ROC analysis of a prognostic model for OS in HCC patient cohort from training (A, D, G) and validation datasets. A, B The distribution of risk score and survival status corresponding to the expression of each gene. C, D Kaplan-Meier analysis suggested that patients in high-risk group had shorter OS than those in low-risk group. E, F Time-dependent ROC curves to assess the performance of gene signature. ROC, receiver operating characteristic; OS, overall survival; HCC, hepatocellular carcinoma; ICGC, International Cancer Genome Consortium Japan

