FIG. 3.
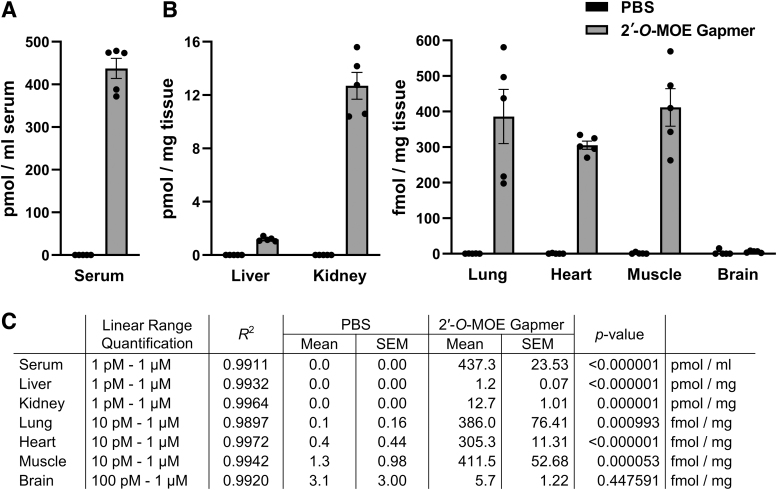
Detection of 2′-O-MOE gapmer after tail vein injection in a mouse model. Blood and tissues were collected 1 h after administration of 20 nmol 2′-O-MOE gapmer or PBS (control). Serum was separated from blood, and tissues were lysed using RIPA buffer. (A, B) The concentration of 2′-O-MOE gapmer in (A) serum and (B) tissues was quantified using the SplintR qPCR assay. Bars represent mean ± SEM from five animals with values of the individual animals (●); each data point represents the average of technical triplicate qPCR wells. (C) The table lists the linear range of the standard curve and the concentration of the 2′-O-MOE gapmer in tissue samples. The linear range of qualification and the coefficient of determination (R2) were obtained from standard curves, which have been presented in Supplementary Fig. S5. The p-value was calculated by comparing the data from each 2′-O-MOE gapmer-treated group to the corresponding PBS (control) group using a t-test. PBS, phosphate-buffered saline; RIPA, radioimmunoprecipitation assay; SEM, standard error of the mean.

