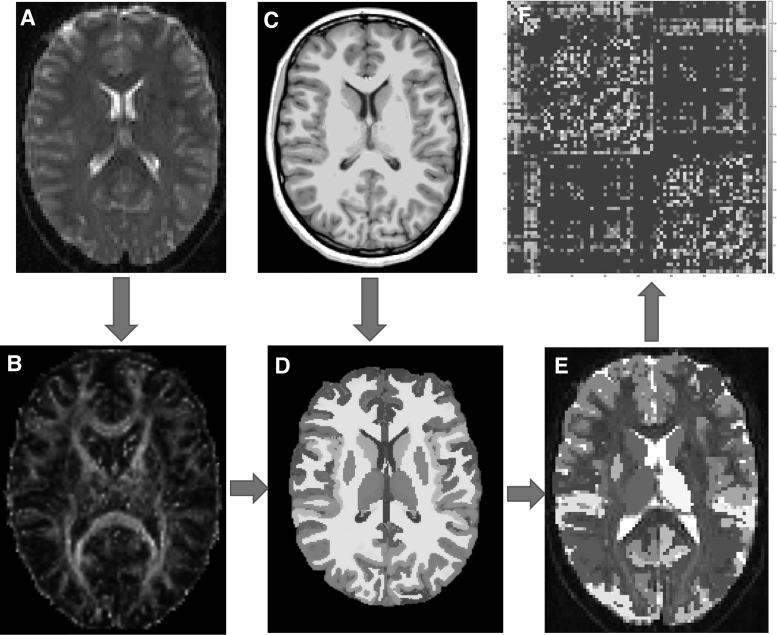
FIG. 1.
Individual level imaging data analysis and network construction. (A) DTI data; (B) Estimated tensor directions with two-crossing fiber model; (C) T1-weighted structural MRI data; (D) Parcellated structural image based on Desikan–Killiany Atlas; (E) Seed masks in diffusion space, binarized, and transformed from structural space; (F) Symmetric and weighted 78 × 78 connectivity matrix. The edges were calculated based on the number of fibers in tractography. DTI, diffusion tensor imaging; MRI, magnetic resonance imaging.

