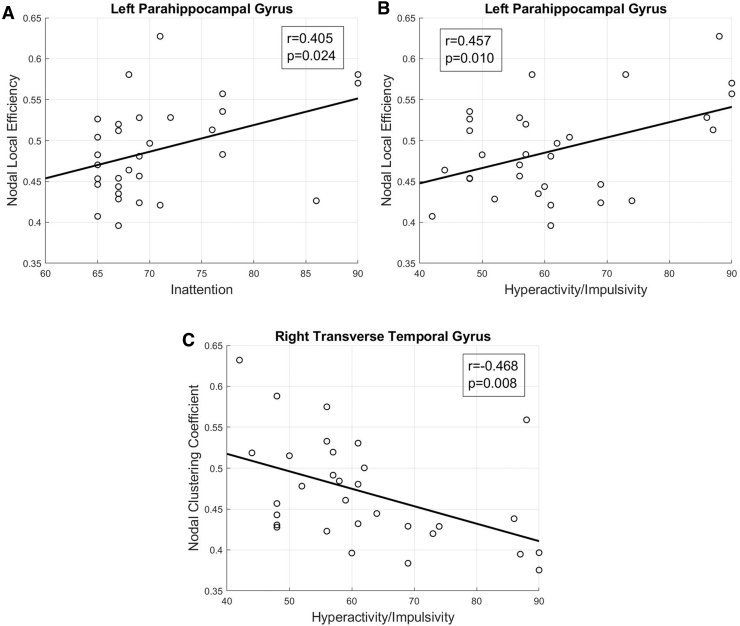
FIG. 3.
Regions that showed significant brain-behavior correlations in the TBI-A group. The p-values reported in the figure were after Bonferroni correction. (A) Correlation between hyperactive/impulsive symptoms severity score and nodal local efficiency of left parahippocampal gyrus. (B) Correlation between inattentive symptoms severity score and nodal local efficiency of left parahippocampal gyrus. (C) Correlation between hyperactive/impulsive symptoms severity score and nodal lustering coefficient of right transverse temporal gyrus.

